

Data Mining Netflix

Bottom Line Up Front:
71% of TV shows don’t make it to season 2 and most Netflix actors are Indian.
Abstract
This study explores Netflix’s entertainment catalog through data analytics to uncover strategic insights relevant to media production and brand engagement. The analysis addresses the research questions. Findings indicate that India is a dominant contributor to Netflix’s film production, particularly through its directors and actors. This suggests a strategic investment by Netflix in the Bollywood market, which correlates with the region’s large population and cultural influence. Movies are significantly more prevalent than TV shows, likely due to their shorter time commitment and appeal for binge-watching. Notably, 71% of Netflix TV series are not renewed for a second season, indicating that the platform may serve as a testing ground for episodic content.
Audience maturity ratings skew heavily toward adult content, aligning with Netflix’s current branding and viewer base. The most frequent keywords found in film titles and descriptions are “love” and “life,” suggesting common narrative themes across genres. This research contributes to the field of data analytics and the entertainment industry by demonstrating how exploration of variables such as category, rating, and title can optimize content strategy. . While this study is based on a sample of Netflix content from a three-year period, future research with larger datasets could support further classification, prediction, and trend analysis.
Research Questions:
1. What country produces the most films for Netflix?
2. Who are the top 20 actors that appear in the most Netflix films?
3. Who are the top 20 directors for the Netflix film catalogs?
4. What is the average film runtime?
5. What is the frequency of audience maturity ratings?
6. What is the frequency of Movies vs. TV shows?
7. What are the top 20 film categories?
8. What are the keywords are used in film titles per category?
9. What are the keywords used in the film description category?
Context:
The contribution of this study to the field of Data Analytics and the entertainment industry is to investigate data about Netflix shows. With this information a media company can maximize the investment put into the video content. An article titled, Brand Engagement in Light of Post Content Type on the Facebook Platform in the Selected Industry, showcases a study using data exploration to investigate video data using the identical variables of ‘category’, ‘ratings’, and ‘Title’ (GATR, 2020). They found that these variables are key factors in overall content engagement and brand awareness. Data exploration is about interrogating independent variables to find insights that are not unknown or have little knowledge in the industry. Understanding these variables can help describe the relationship between any independent variables / dependent variables.
Data:
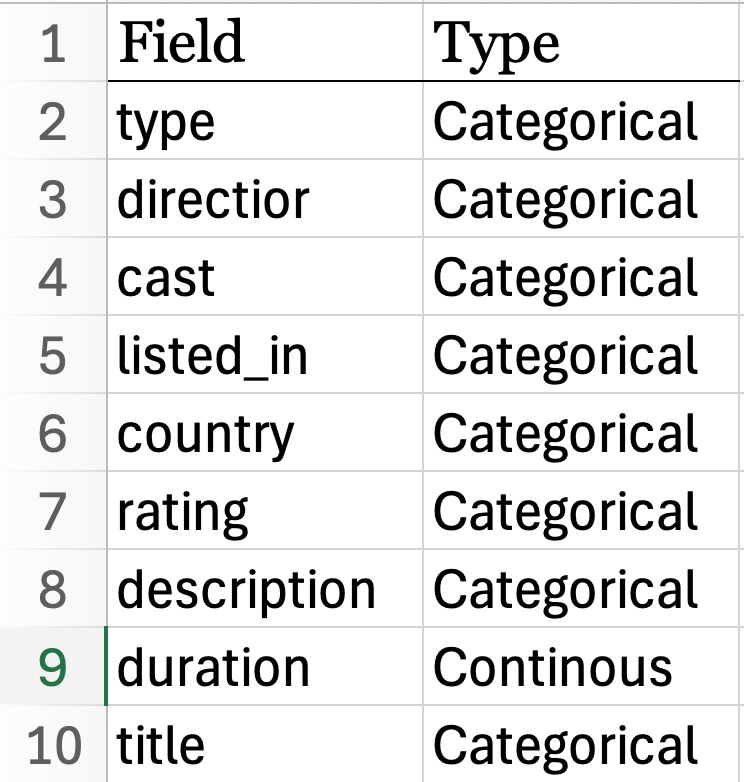
An opensource dataset of Netflix data containing the necessary variables about videos watched in a particular time period. A Kaggle dataset from www.kaggle.com. Kaggle is the opensource repository / organization that hosts the datasets. The dataset contains almost 8,807 rows (before any rows where removed) and 11 columns. The dataset is limited to only to the years of 2001-2023 videos watched on Netflix; The dataset has multiple columns for possible exploration. Different audiences watch shows at different time-zones all over the planet. Delimitations for this analysis, only 9 columns of interest will be used: The ‘type’, ‘director’, ‘cast, ‘listed_in’, ‘county’, ‘rating’, ’description’,’ duration’, and ‘title’; Therefore of the 11 columns only 9 are relevant for non-trivial insights.
Available to the public via Kaggle.com, meaning that the dataset may be limiting in accuracy and completeness; The dataset can be found at the link below:
https://www.kaggle.com/datasets/infamouscoder/dataset-netflix-shows
A copy of the GitHub code can be found in the link below:
https://github.com/Bloomingbiz/Blog_codes/blob/main/Netflix%20Data%20Study.ipynb
Data Gathering:
Plan and direct data gathering to opensource repositories (Google). Looking for keywords such as “Netflix”, “data “+ .csv”. Next, selecting the 1st to 3rd ranked piece of content (reachable csv file) and inspecting each csv file for quality such as “length” (at least 7k rows), data cleanliness, massive gaps in data, and enough relevant variables to create an ‘X’ and ‘Y’ axis. Available to the public via Kaggle.com means that it may be limiting in accuracy and completeness. The dataset is 3% sparse and all missing or null columns will be dropped when cleaning the dataset.
Data Analytics Tools and Techniques:
A KDE plot was used to visualize the distribution and Shapiro-Wilk was used to test for normality. Data exploration is germane to studying this data because it can visualize and explain distributions of data. Overall, this is an exploratory quantitative data analytic technique and a descriptive statistic. The tools used will be Jupyter Notebook operating in Python code, running statsmodel api as a reliable open-source statistical library. Due to the data size, a Pandas data frame will be called, same with Numpy and Seaborn will be used for visualizations. Matplotlib.pyplot will be the visualization library, generating a presentation Layer – of univariate and by bivariate graphs.
Justification of Tools/Techniques:
Python will be used for this analysis because of Numpy and Pandas packages that can manipulate large datasets (IBM, 2021). The tools and techniques are common industry practice and have consensus of trust.
The technique is justified through the integer variables necessary to plot against a timeline. In so doing, may just reveal different modes of frequency distribution. Another reason why data exploration is ideal is because the data is based off of human viewing behavior, which is notoriously skewed. Because of the size of the dataset, pandas and Numpy will be called. Python is being selected over SAS because the Python has better visualizations (Panday, 2022).
Project Outcomes:
In order to find statistically significant differences, the proposed end state is a statistical mapping that can compare the distribution shapes of the targeted variables (Statology,2019). A cleaned dataset of all the correctly labeled columns and rows, for replication. A better understanding of previously stated groups with exploratory graphs, giving support as to what time engagement maybe highest. Lastly, a copy of the Jupyter NoteBook with the Python code will be available, along with a video presentation added by PowerPoint. According to the same study, data exploration was instrumental in support for future null and alternative hypothesis, against other categorical variables. (GATR, 202O).

While the United States has almost 3.5 times the number of Netflix productions compared to India, Indian actors make up the top 13 spots for actor appearances.

The below graph of directors shows that Rajiv Chilaka is the most frequent Netflix director.

The below graph showcases the frequency of the movie durations. It suggests that films that are 90-120 minutes in length are the average on Netflix.

The below graph indicates a left skewed distribution when comparing the number of tv shows to the season length.
Notice that 1 season is the highest frequency. A 71% decrease in show quantity; Suggesting a 71% chance that a Netflix TV Show will not make it to season 2.

The below graph indicates that TV-MA gets has the highest frequency of shows; While rated “R” is a 77% decrease. Suggesting that an ‘R’ rating is exclusive to ‘movies’ and TV-MA = TV Show rating. It appears that both TV-MA and TV-14 are the leading two ratings of film productions. The data also suggests that Netflix shows are primarily for adults, given the higher rating instances for TV-MA and R.

However, the frequency of ‘Movies’ vs. ‘TV Shows’ tells an inverse story. The dataset consisted of ‘0’ duplicate values, yet Movies are a higher frequency of watch vs. TV Shows; Which is contrary to the previous graph.

The following graph shows the the Top 20 film categories and their frequency on the ‘x’ axis. Notice that “International Movies’ are ranked number 1 and ‘International TV Shows’ are ranked number 4.

Below is a WordCloud of common words used in the film ‘descriptions’ and ‘titles’.
The size of the word indicates the frequency.What words stand out to you?


In final analysis:
1. What country produces the most films for Netflix?
The United States produces the most films.2. Who are the top 20 actors that appear in the most Netflix films?
See above graph: The top 13 are all Indian.3. Who are the top 20 directors for the Netflix film catalogs?
See above graph.4. What is the average film runtime?
90 -120 minutes is the overwhelming frequency.5. What is the frequency of audience maturity ratings?
TV-MA is most frequent with TV-14 second. 6. What is the frequency of Movies vs. TV shows?
More movies have been watched vs. shows.7. What are the top 20 film categories?
International Movies are number 1 while Dramas are 2nd; See the above graph.8. What are the keywords are used in film titles per category?
See above graphs.9. What are the keywords used in the film description category?
See above graphs.In closing, it would appear that film production companies in the United States prefer to hire Indian actors to pander to a broader international audience. While most productions are from U.S. companies, the data suggests that Netflix is heavily investing into the Baliwood market, especially since the most common director is Indian; Corresponding, with the population of India and its neighboring cultures. Moreover, International Movies are the most frequent with International TV Shows being the 4th frequent. Additionally, while the audience maturity ratings are highest for TV shows. Interestingly, Netflix TV shows only last one season, with a 71% chance of not getting picked up for another season. Therefore, the average pilot series only has a 29% chance of getting funding for a 2nd season. At the same time, it appears that Netflix is a testing platform for TV shows. However, the majority of watched productions are Movies with an average of a 90 -120 min runtime; Movies are a low commitment of time vs. TV Shows, since modern audiences enjoy “binge watch” the show. Given the high count of adult rated shows, it would appear that Netflix is a platform skewed towards adults and not so much kids; Which makes sense for the “Netflix and chill” community. Lastly, the two most common words that appear in most WordClouds of titles or descriptions are: “love” and “life”. While the data explored is one generalization from a sample of Netflix shows watched during a 3 year period, more data needs to compiled and anlayized for future exploration, predictions, and classifications.
Work Cited
(PDF) customer engagement factors in Facebook brand pages. (n.d.-a). https://www.researchgate.net/publication/281323700_Customer_Engagement_Factors_in_Facebook_Brand_Pages
(PDF) promoting social media engagement via Branded Content Communication: A fashion brands study on Instagram. (n.d.-b). https://www.researchgate.net/publication/358322977_Promoting_Social_Media_Engagement_Via_Branded_Content_Communication_A_Fashion_Brands_Study_on_Instagram
Minds, H. (2024, October 3). How netflix and Amazon use predictive analytics to anticipate customer needs before they even know... Medium. https://medium.com/@hybrid.minds/how-netflix-and-amazon-use-predictive-analytics-to-anticipate-customer-needs-before-they-even-know-26653ba808aa
Mixson, E. (2025, March 19). Data Science at netflix: Analytics strategy. AI, Data & Analytics Network. https://www.aidataanalytics.network/data-science-ai/articles/data-science-at-netflix-how-advanced-data-analytics-helped-netflix-generate-billions
Pandey, Y. (2022, May 25). SAS vs python. LinkedIn. https://www.linkedin.com/pulse/sas-vs-python-yuvaraj-pandey/
What is data mining? - coreapp article. CoreApp Technologies. (n.d.). https://coreapp.cz/en/blog/article-what-is-dataming

Powered by Data Mining Mike: America’s Big Data Authority