

How Many Solar Panels are Required to Power a House?

Abstract:
Bottom Line Up Front: Newer panels out-produce older panels (exponentially).
Situation, for the betterment of the human condition and planet, a big data science study was conducted given a dataset provided by Google Project Sunroof. Google Project Sunroof is a massive data mining operation, manifested primarily via satellite imagery and providing over 31 solar-panel related variables to be explored. With this information, a solar company can explore the best place to install solar panels. Mission, the aim of the study is to extract, clean, reduce, and statistically test the information; To create a linear model that can predict solar power generation based on the following variables: ‘latitude’, ‘longitude’, ‘state_name’, ‘kw_total_power’, ‘number_of_panels’, and ‘yearly_sunlight_kwh_total’. Prior to the linear model, Principal Component Analysis was conducted first, to explain the dimensionality of the dataset and reduce computation time. Resulting, in a machine learning model with a nine percent accuracy. Therefore, an accurate linear model could not be constructed from the data, due to the inherent skew in the distribution. Reasonably, no amount of ‘new’ or ‘relevant’ data, added to the analysis, will change earth’s position in space relative to the sun. States on or near of the 38 degrees latitude or -80 degrees longitude will receive more average sunlight and produce more power than northern states. The only exception appears to be Washington State, as it generates the most power output per panels, in the United States; Ranking it almost equal to the State of Florida.
Research Question:
Can an accurate predictive Multivariate Linear Regression model be constructed from the data?
Null Hypothesis H0:
There is no significant linear relationship between the independent variables and dependent variables. Therefore, the Coefficients of the slope values are equal to zero.
Alternative Hypothesis H1:
There is a significant relationship between at least one of the Independent Variables (IV) and at least one Dependent Variable (DV).

Context:
The contribution of this study to the field of Data Analytics and the Solar Energy, is to create a Multiple Linear Regression Model to investigate relationship between variables. With this information a solar energy company or consumer can maximize an investment put into solar panel installation.
An article titled, Modeling Power Output of Horizontal Solar Panels Using Multivariate Linear Regression and Random Forest Machine Learning, showcases a study using Multivariate Linear Regression testing to predict energy production using the identical variables of ‘Latitude’, ‘longitude’ , ‘State_name’, ‘KW_total_power’, and ‘number_of_panels’ (Air Force). The Multivariate Linear Regression, tests the null hypothesis that the population median of all of the groups are equal. Understanding these variables can help describe the relationship between the IV and DVs.
Data:
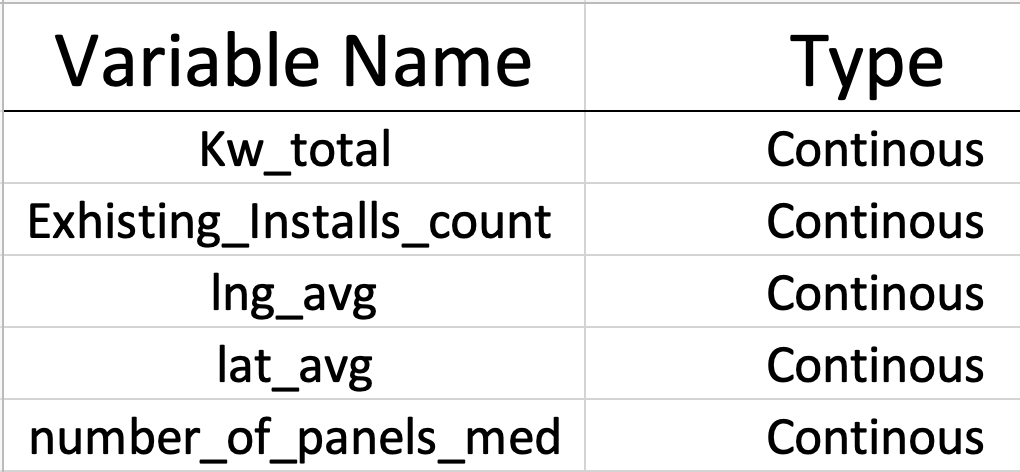
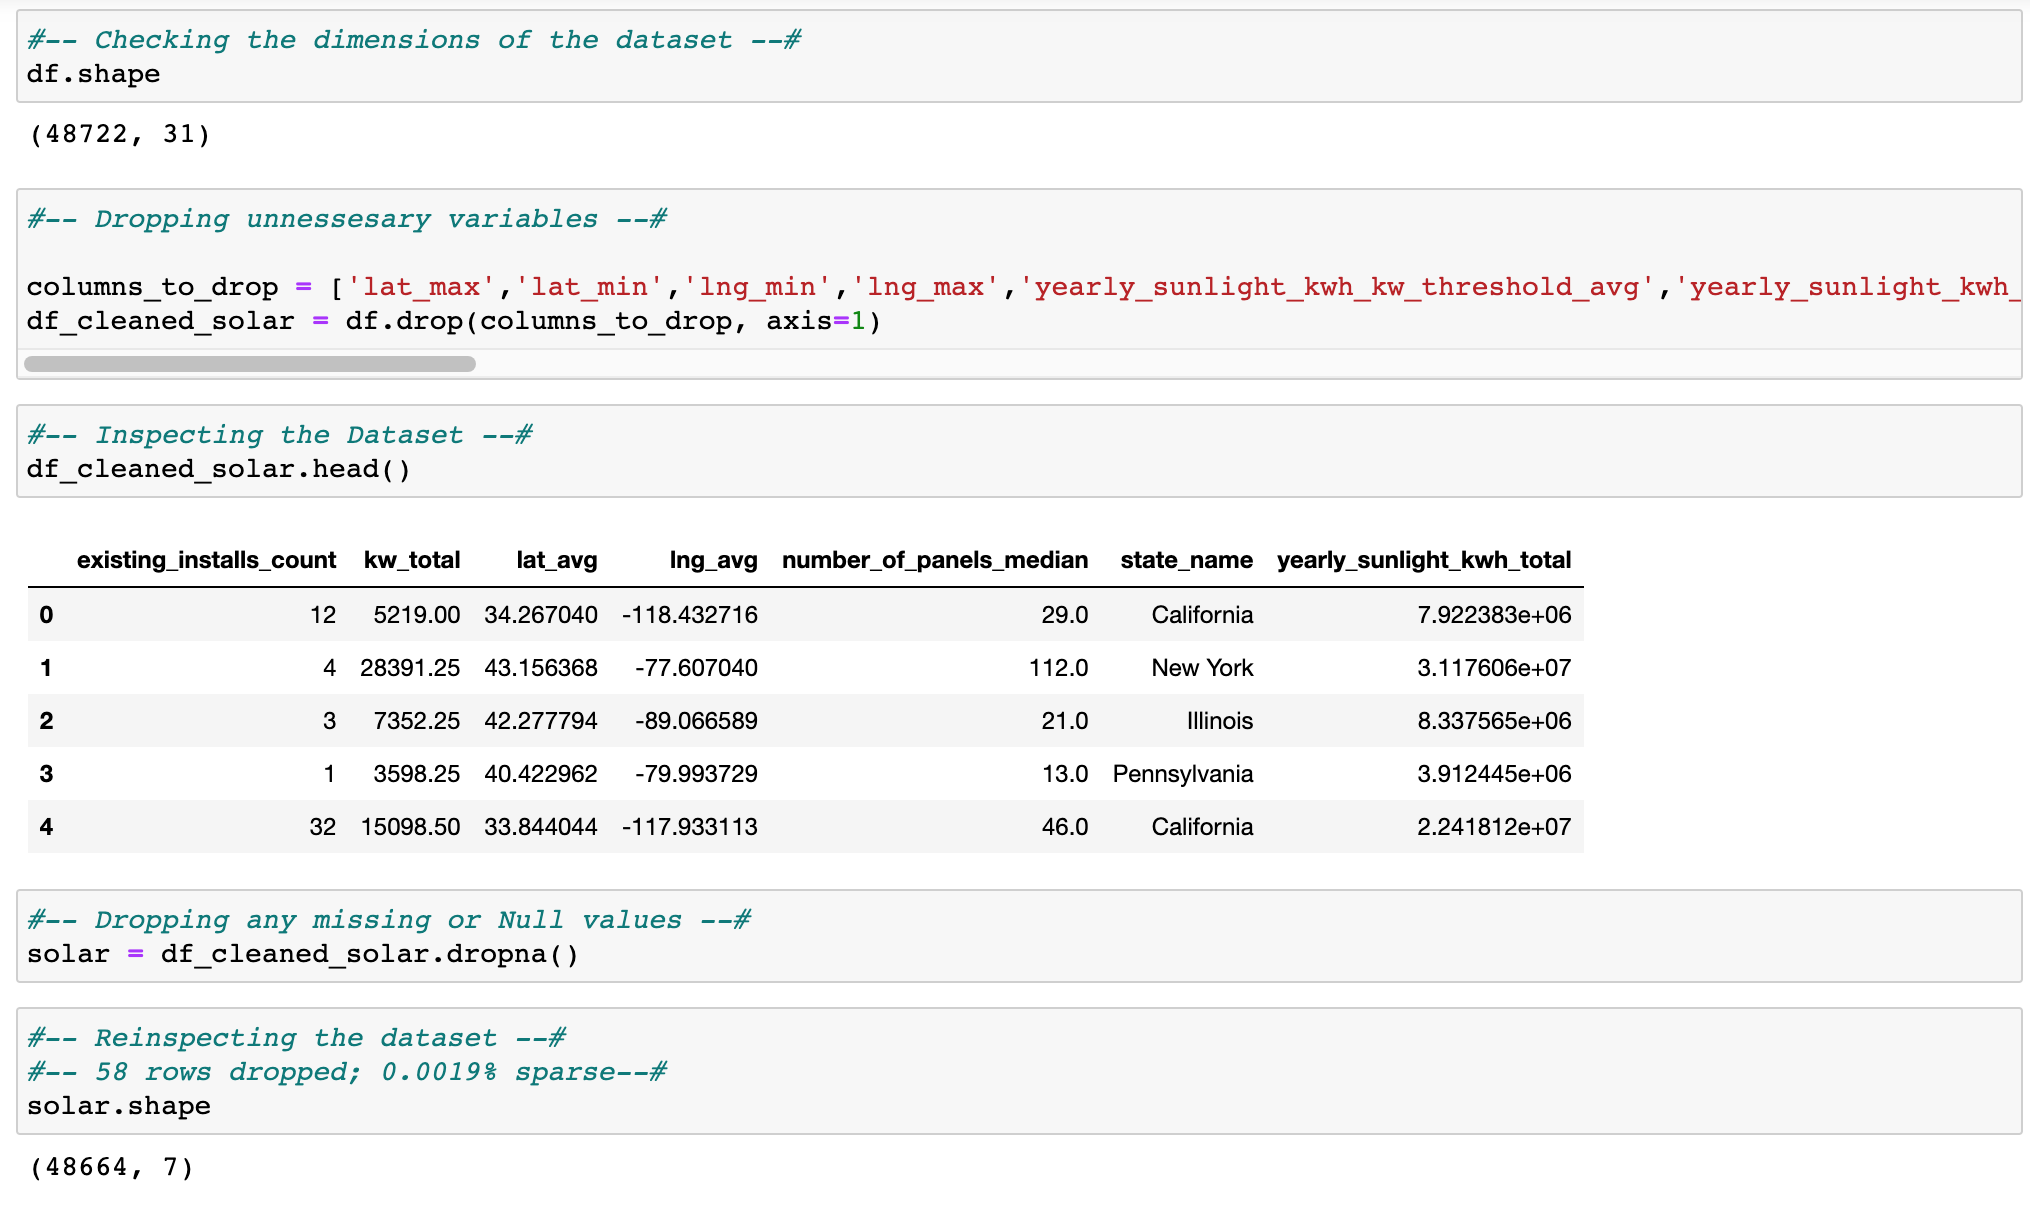
An opensource dataset of Google Project Sunroof data containing the necessary variables. A Kaggle dataset from kaggle.com. Kaggle is the opensource repository / organization that hosts the datasets. The dataset contains almost 48,722 rows (before any rows where removed) and 31 columns. The dataset is limited to only 3 years of Google Project Sunroof data; Uploaded from 2017 – 2018. The dataset has multiple columns for possible exploration. Delimitations for this analysis, only 5 columns of the dataset will be used as they factor into the model. The dataset is easy to work with. The variables of: ‘Existing_installs_count’, ‘kw_total’, ‘lat_avg’, ‘lng_avg’, and ‘number_of_panels_median’; The dataset is easy to work with because the columns contain integer values. Limitations of the study is that 6 variables will be observed, one variable ‘yearly_sunlight_kwh_total’, was removed due to multicollinearity. Of 31 variables only 5 will be considered for the study. Below is an image of the variables used.

The following is the python code for the analysis:


Below is a graph of a the average number of solar panels per state:
Take note of the number of panels Washington State has in the graph below; Contrast that to states on a similar longitude.


Notice how much power is generated in Washington State compared to Maine. Then notice Florida. The state that generates the most solar power is Texas.

According to the location density graph above, the Eastern U.S. has more solar panels than west of the Mississippi River. Take note in the next two graphs below, solar power production primarily takes place starting in southern California, through the southwestern states and passing through the southern half of Florida.

Yearly sunlight is .99% correlated to solar power production.

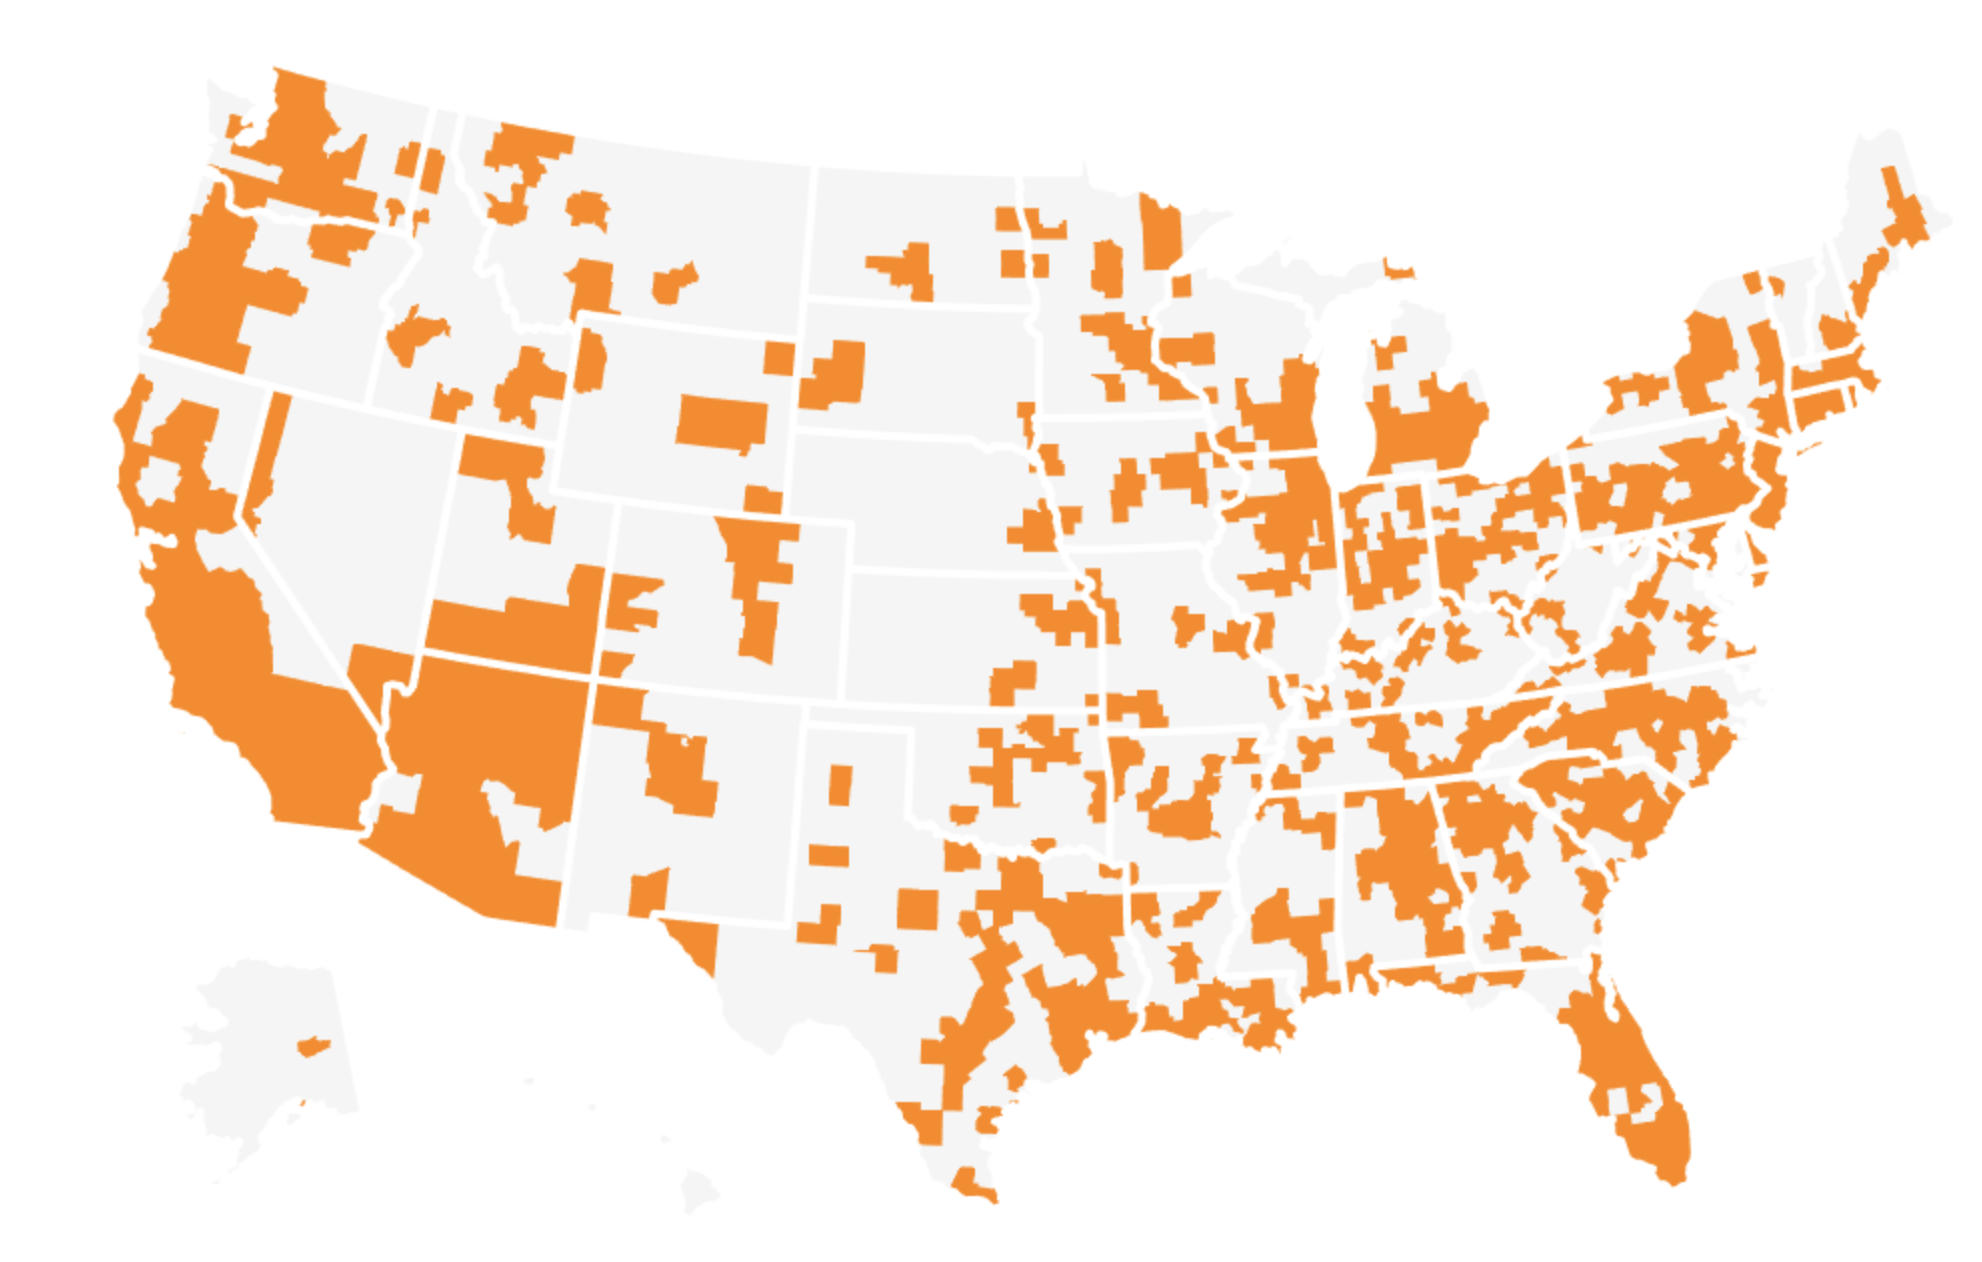
This is a more detailed images of solar panel locations in the United States sourced from Google Project Sunroof website 2023.


Notice the higher amount of power being produced around the 300 panel quantity mark.


The above graph shows that ‘kw total’ is correlated to ‘yearly-sunlight-kwh-total’ at 99%. Therefore, ‘yearly-sunlight-kwh-total’ needs to be dropped due to multi-colinearity. On the graph above, the index where ‘exisiting-installs-count’ meets ‘kw_total’, indicates that 0.24 or 24% of the total kilowatts produced where from existing panels (older generation).
Next, Principal Component Analysis (PCA) was conducted. PCA is an Unsupervised Machine Learning method :


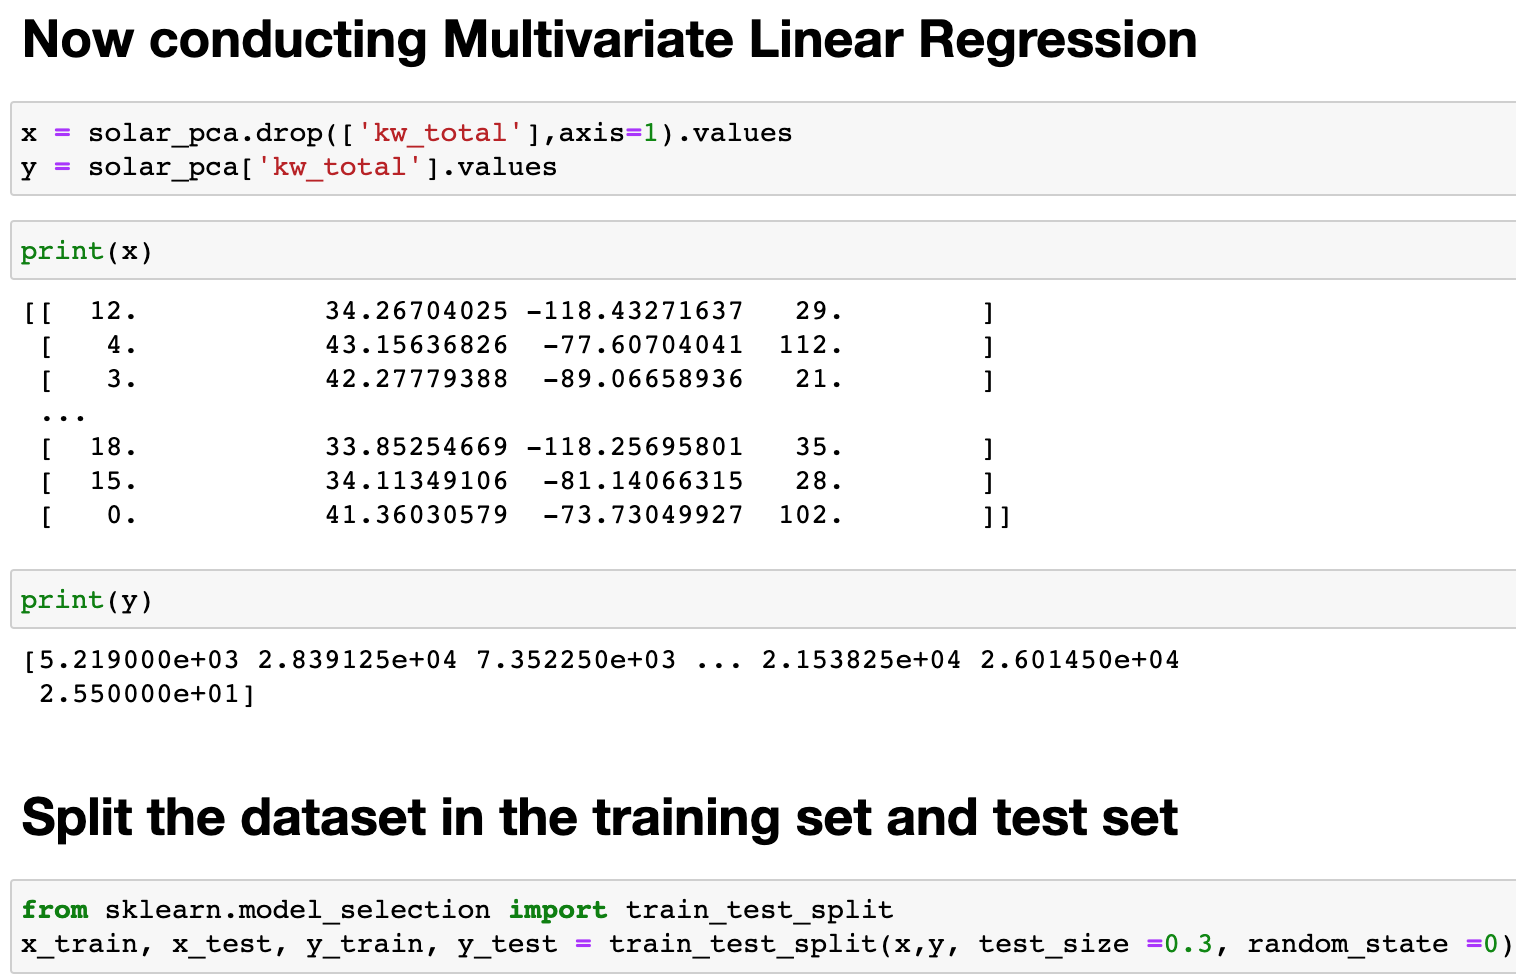
The dataset was split 70% to training the model and 30% to testing the model.


The above plot appears to exhibit the same homoscedasticity in all variables compared. Its seems to indicate two regression lines. Pattern resemebles the same left-skew as all the individual variables.


In final analysis,
The null hypothesis is tentatively accepted, there is no significant linear relationship between the independent variables and dependent variables. While the Principal Component Analysis was helpful in explaining the variance, the Multivariate Linear Regression model yielded a Coefficient of Determination of 0.09; Less than 10% accuracy. Answering the research question, as apparently, no. Given the left-skew of all the variables indicates that a linear regression model is not the best model for the data and other non-parametric Machine Learning models should be explored to create a model that produces a better prediction. However, the analysis did yield interesting insights. Aside from a .99% correlation between average yearly sunlight and power production (proximity to equator); It showed that there was very little correlation amongst variables. Indicating that more panels don’t necessarily produce more power. What the data seems to suggest is that fewer quantities of newer generation panels generate more solar power than exponentiated quantities of older panels. The glaring outlier being the State of Washington, being ranking number six in the nation for solar power generation.

Work Cited:
Google Project Sunroof Data description and Methodology
https://sunroof.withgoogle.com/assets/data-explorer-methodology.pdf
Google Project Sunroof
https://sunroof.withgoogle.com/
Google Project Sunroof dataset:
https://www.kaggle.com/datasets/jboysen/google-project-sunroof
Multiple Linear Regression
https://towardsdatascience.com/super-simple-machine-learning-by-me-multiple-linear-regression-part-1-447800e8b624
Python vs. R: What's the difference? IBM. (n.d.). Retrieved January 18, 2023, from
https://www.ibm.com/cloud/blog/python-vs-r
What is Principal Component Analysis?
https://www.stat.cmu.edu/~cshalizi/uADA/12/lectures/ch18.pdf
Air Force Institute of Technology, Solar Panel Studies
https://scholar.afit.edu/cgi/viewcontent.cgi?article=3349&context=etd