

How Many Tesla Fires Reported in 2023?

Abstract
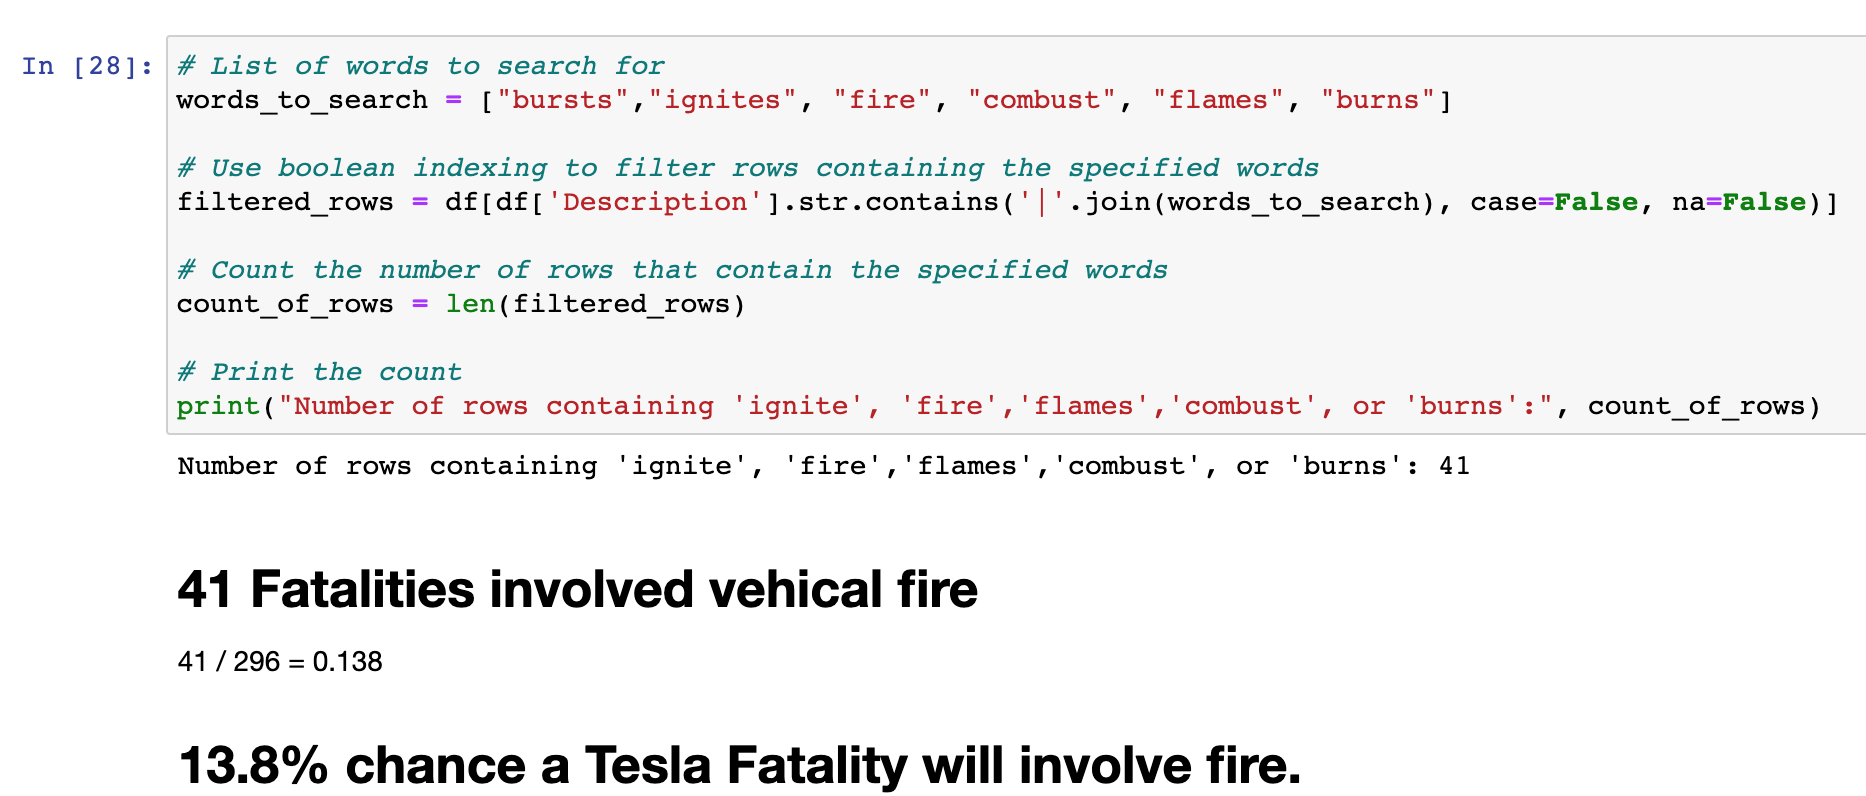
Bottom Line Up Front: 13.8% of Tesla automobile fatalities involve “fire” or “combustion”.
With the rise of Electric Vehicles on the roads and policy makers with aspirations of reduced carbon emissions, there poses a glaring statistic documented in the crash “descriptions” column of over 296 deadly accidents involving Tesla vehicles from 2013 - 2022. While 296 accidents is not that many in hindsight, further sample testing must be conducted in the future to determine if the information is statistically significant to the overall vehicle population. The descriptive statistic now serves as a baseline to compare against other Electric Vehicle (EV) makers and EV fires vs. combustion engine fires. The data was cleaned and explored. The crash “description” column was iterated over and a WordCloud display of word frequency produced; Followed by a count of unique rows containing the following words: “Fire”, “ignites”, “combusts”. The result was 41 unique cases / 296 total = 13.8% involving “fire”.
Data Gathering:

Planing and direction of data gathering sourced from ‘opensource’ repositories (Google). Looking for keywords such as “Tesla”, “automobile”, “crashes”, “+ .csv”, + “2023”. Next, selecting the 1st to 3rd ranked piece of content (reachable csv file) and inspecting each csv file for quality such as “length” , data cleanliness, massive gaps in data, and enough relevant variables to create an ‘X’ and ‘Y’ axis. Available to the public via Kaggle.com means that it may be limiting in accuracy and completeness. The dataset is 0.04 % sparse and all missing or null columns will be dropped when cleaning the dataset.
A continuous, study from Telsadeaths.com, reports a higher rate of fire-related deaths at 17%; dataset can be found here: tesla-fires
https://www.kaggle.com/datasets/thedevastator/tesla-accident-fatalities-analysis-and-statistic
Stated on Kaggle by the original source miner, thedevastor:
“This dataset provides a comprehensive overview of the Tesla vehicle accidents that have resulted in fatalities. It includes details on the date and location of each incident, model involved, crash description, fatalities, and Autopilot usage. This dataset can be used to analyze the frequency and locations of these fatal accidents as well as gain valuable insights into potential safety risks associated with driving/operating Tesla vehicles” (2023).

Now beginning Exploratory Data Analysis: The following shows importing the necessary statistical libraries, the dataset, inspecting the output and shape; Then beginning the “cleaning” processes of data mining, by dropping rows with “null” or “empty” values.


The above graph shows that most fatalities occurred in 2022. Lowest number being in 2013 and increasing. 2022 is double that of 2021.

The above graph shows that most fatalities involved one death. While the below graphs, indicate that California is the state with the highest rate and a crash has only happened in 43 of the 50 United States in 2022.


Below shows the frequency of Tesla car deaths against country. It would appear, that more people are willing to initially ride as passengers in USA, Canada, Germany, and China.


The following code takes all the words in the crash descriptions column of the data set and outputs a display of the common used words in the corpus.

The size of the word(s) indicates the frequency count in the dataset.

First glance, the glaring result is “multi”, “car”, “vehicle”, “collision”. Then directly in the center of the page is “rear”.
Now generating exploratory statistics by finding the number of rows with the following words related to: “bursts”, “ignites” , “fire”, “combust”, “flames”, “burns”.

In final analysis,
when cleaned and explored, the Tesla Motor Fatalities Dataset indicates, that more victims are passengers in the countries of: USA, Canada, Germany, and China; While the vast majority of deaths involve one person. Noticeable increase in deaths starting at 2020. The number of Tesla deaths doubled in 2022 vs. 2021. Since the inception of the Tesla EV, only 43 states have had fatalities. The words describing the fatalities, ‘fire’ and its synonyms where counted in 41 different instances; yielding a descriptive statistics of 13.8 % of Tesla Motors fatalities involving flames. As a baseline statistic, this study can now be useful in distribution testing relative to the U.S. auto deaths population baseline. Overall, more data, needs to collected and examined overtime to monitor this trend. Also, this study serves as a baseline for comparing Electric Vehicles (EVs) as more automakers manufacture for the daily driving.
Work Cited
Pandey, Y. (n.d.). SAS vs python. LinkedIn. Retrieved January 18, 2023,
https://www.linkedin.com/pulse/sas-vs-python-yuvaraj-pandey/
Python vs. R: What's the difference? IBM. (n.d.). Retrieved January 18, 2023, from
https://www.ibm.com/cloud/blog/python-vs-r
Exploratory Data Analysis
https://towardsdatascience.com/exploratory-data-analysis-8fc1cb20fd15
https://www.kaggle.com/datasets/thedevastator/tesla-accident-fatalities-analysis-and-statistic