

How Many People Have Been Killed in Tesla Fires: Tesla Motors vs. Combustion Engines 2023.

Abstract
Bottom Line Up Front: Tesla Automobiles are 48X MORE likely to fatally-catch-fire vs. combustion engines.
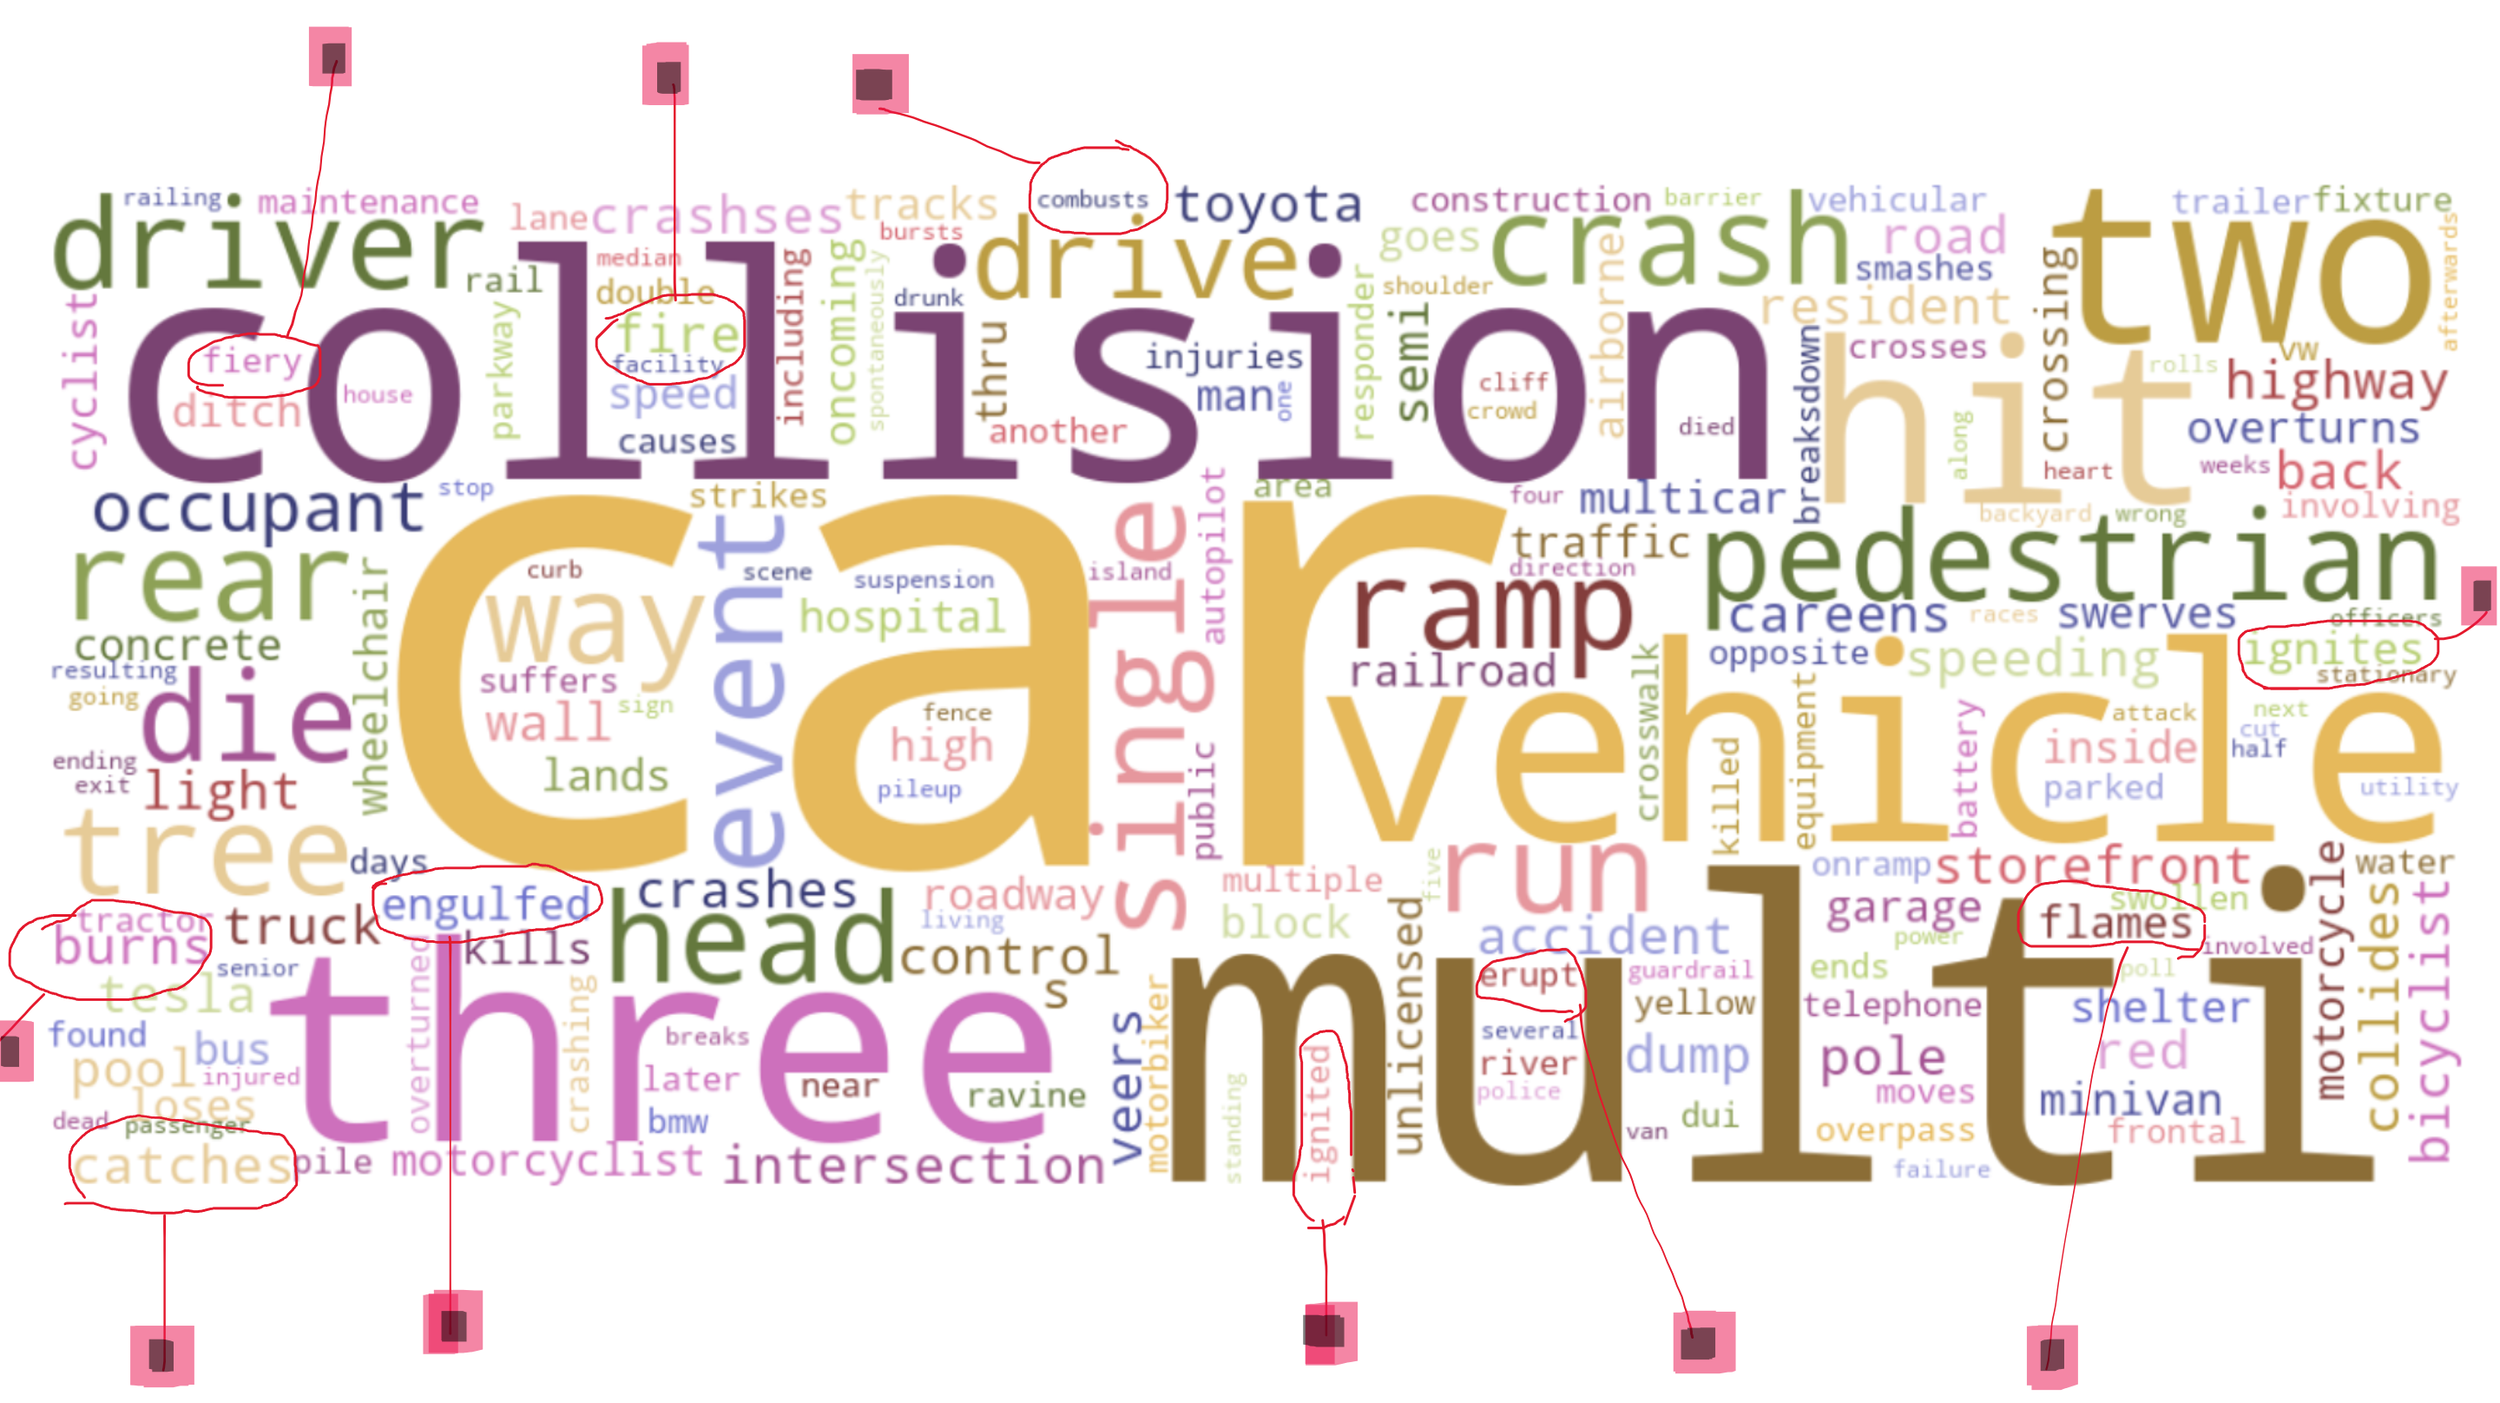
The following study compares two datasets: Countrywide 'descriptions' of fatal accidents vs. Tesla Death 'descriptions'. The Cornell University Countrywide big data study (7.7 million rows or instances) was originally compiled to predict the severity of car accidents with several exogenous factors. The big data study also comes with an accident 'description' column, containing words to be tallied; The column is compiled of the individual documented ‘descriptions’ of the accidents. The words to be searched are: “fire”, "bursts", "ignites", "ignited", "combusts", "flames", "burns", "fiery", and "erupt". The Tesla automobile fatalities dataset (Tesla Deaths) will be compared to the big-data-baseline. The Tesla Deaths dataset has a 'description' column that can be exploited for the same keywords. The results where that 14.5% of Tesla deaths involve ‘fire’ or synonyms; In contrast the countrywide average is only 0.3%. The two statistical tests used, led to the rejection of the null hypothesis. No, 14.5% and 0.3% are not in the same range or proportion within a sample population. Importantly, 14.5% represents roughly 145 out of every 1000 occurrences of death will contain 'fire' or its synonyms. However, the national baseline is 0.3% equivalent to 0.003 in decimal form. This represents a much smaller proportion, indicating only 30 occurrences out of every 10,000 instances.
Research Question(s):
Does the Number of Tesla Motor's Deaths involving, "Fire" and its synonyms, differ from the US population?
Can a Mann-Whitney U test be constructed from the data to examine the two populations?
Can a Kruskal-Wallis model be constructed from the data to examine the two populations?
The term ‘null’ comes from the Latin word ‘nullus,’ meaning ‘none’ or ‘zero.’ In essence, the null hypothesis represents the absence of an observed effect or relationship.
Kruskal-Wallis
Null Hypothesis H0: There is no difference between the distributions of the scores of these two populations.
Alternative Hypothesis H1: At least one of the two populations differ.
Mann-Whitney (Wilcoxon rank-sum test)
Null hypothesis H0: The distributions of both populations are identical.
Alternative Hypothesis H1: That the distributions are not identical.

The contribution of this study to the field of data science and consumer awareness is to create a Mann-Whitney U test and Kruskal-Wallis test to investigate population distributions. With this information first responders, consumers, and insurance companies can be informed. The study is the first of its kind involving electric vehicles fires and Big Data testing. Kruskal-Wallis is used to explore differences between the two or more continuous variables of separate dataset(s). The Mann-Whitney tests assumes that the population samples are from the same distribution and not-normally distributed (Scipy, 2020). Two variables to be explored are the ‘Deaths’ (count of fatal accidents) and ‘Description’ (written explanation of the accident). The ‘Description’ column was mined for specific target words: ‘fire’ and its synonyms, ‘ignites’, ‘ignited’, ‘bursts’, ‘flames’, ‘combusts’. The unique count of target words can be tallied between each group and examined. The Kruskal-Wallis H-test, tests the null hypothesis that the population median of all of the groups are equal. It is a non-parametric version of ANOVA (Scipy, 2020). Understanding these variables can help describe the relationship between the Independent Variables (IV) and Dependent Variables (DV).
Data Collection
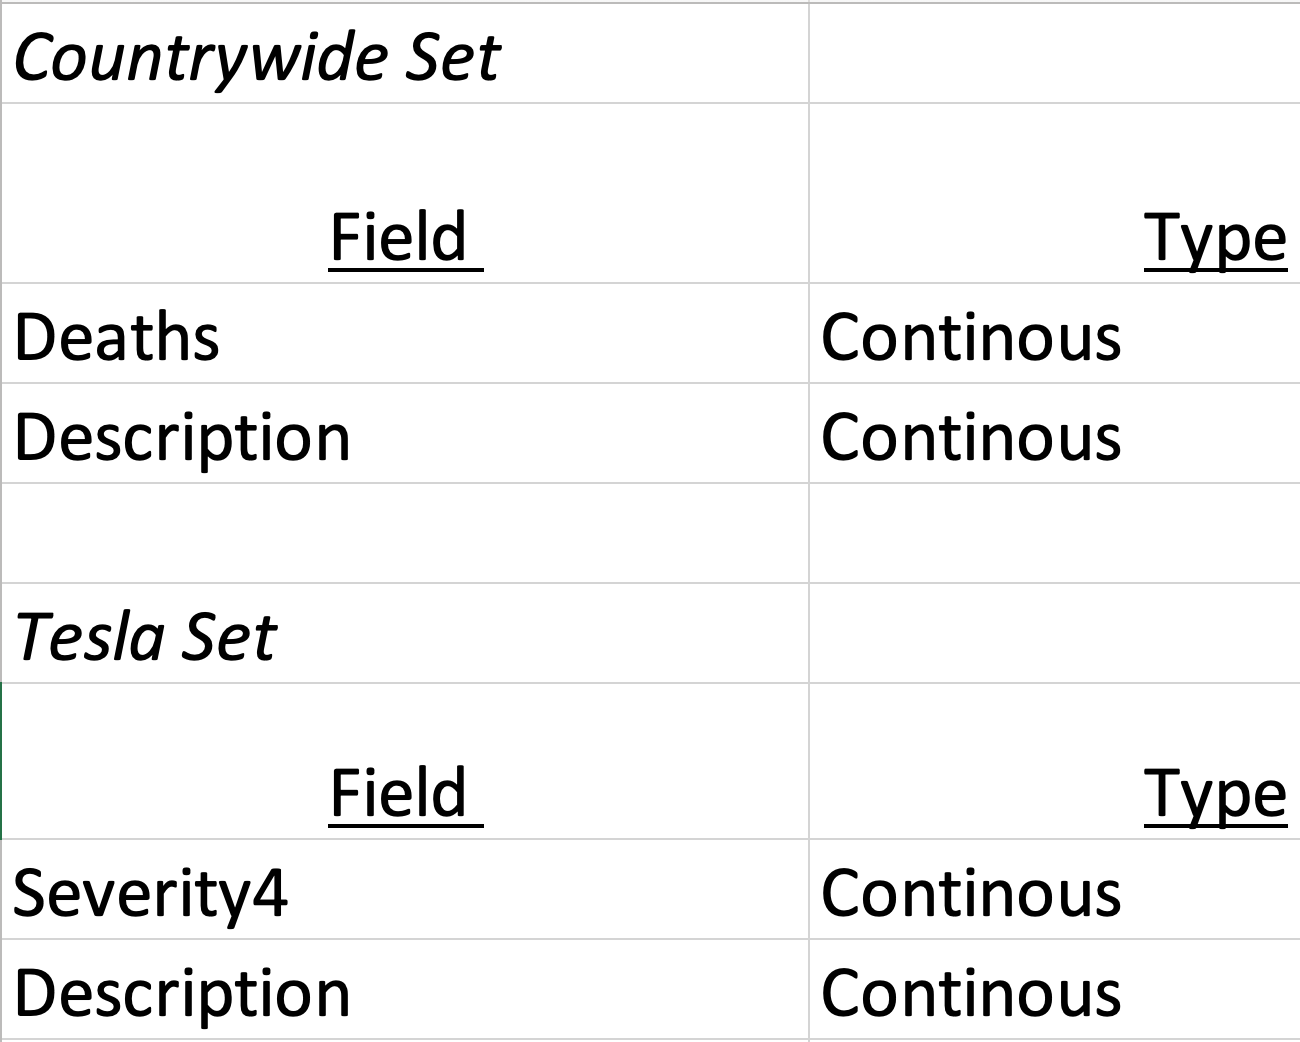
Two opensource datasets of auto accident data containing the necessary variables about auto-accidents; Both can be sourced from www.kaggle.com. Kaggle is the opensource repository / organization that hosts the datasets. The big-data-baseline contains almost 7,728,394 rows (before any rows where removed) and 46 columns. The dataset was compiled in a countrywide study to predict accident severity; Recorded from 2016 – 2023 as part of a Cornell University study. The dataset has multiple columns for possible exploration but will only be limited to the two stated columns. The second dataset is the Tesla Deaths set, reported by Tesla Motors as csv files, can be also found on Kaggle.com. Delimitations for this analysis, only two columns of the dataset(s) will be used as they factor into the exploration: The ‘Deaths’, ‘Description’. The dataset will require some feature engineering as the original accident-severity column ‘Severity’ is hierarchical, 1-4 and will need ‘Severity4’ isolated because that represents an instance of ‘Death’. The ‘Description’ column(s) are initially string variables and will be mined and target words tallied. The aggregated words are a continuous count to be compared in future studies. Links to the datasets can be found below:
https://www.kaggle.com/datasets/sobhanmoosavi/us-accidents
https://www.kaggle.com/datasets/thedevastator/tesla-accident-fatalities-analysis-and-statistic

Below is a picture of the variables use along with the data type:

Data Gathering:
The planning and direction of data gathering was open-sourced from repositories (Google). Looking for keywords such as “Tesla”, “fire”, “auto-accident data”, “+ .csv”. Next, selecting the 1st to 3rd ranked pieces of content (reachable csv file) and inspecting each csv file for quality such as “length” (at least 7k rows), data cleanliness, massive gaps in data, and enough relevant variables to create an ‘X’ and ‘Y’ axis. Available to the public via Kaggle.com, means that it may be limiting in accuracy and completeness. In Kruskal-Wallis, the dependent variable must be a continuous (interval or ratio) level of measurement (Statology, 2019). Fortunately, all dependent variables are continuous. The dataset is < .0001 % sparse and all missing or null columns will be dropped when cleaning the dataset. Additionally, the Tesla Deaths dataset was initially 309 rows and was .4% sparse after cleaning.
Exploration of the dataset distribution with visualizations exploring the different variables of the Countrywide Dataset can be found here:
https://www.kaggle.com/datasets/sobhanmoosavi/us-accidents
Exploration of the dataset distribution with visualizations exploring the different variables of the Tesla Death dataset can be found here:
https://www.bloomingbiz.marketing/blog/how-many-tesla-fires
Data Extraction and Preparation:
Kruskal-Wallis is germane to compare distributions of non-parametric data. Moreover, the Kruskal-Wallis test does not assume normality in the data (Statology, 2019). Overall, this is an exploratory quantitative data analytic technique and a descriptive statistic. The tools used will be Jupyter Notebook operating in Python code, running statsmodel api as a reliable open-source statistical library. Due to the data size, a Pandas data frame will be called, same with Numpy and Seaborn will be used for visualizations. A Kruskal-Wallis test will be the statistical test used with statsmodel’s Kruskal function along with the mannwhitneyu function. Python will be used for this analysis because of Numpy and Pandas packages that can manipulate large datasets (IBM, 2021). The tools and techniques are common industry practice and have consensus of trust. The technique is justified through the integer variables given. In so doing, may just reveal different modes of frequency distribution. Another reason why Kruskal-Wallis test is ideal is because the data is based off of human driving behavior, which is notoriously skewed. Because of the size of the dataset, pandas and Numpy will be called. Python is being selected over SAS because Python has better visualizations (Panday, 2022).

Analysis:
Python will be used for this analysis because of Numpy and Pandas packages that can manipulate large datasets (IBM, 2021). The tools and techniques are common industry practice and have consensus of trust. The technique is justified through the integer variables given. In so doing, may just reveal different modes of frequency distribution. Another reason why Kruskal-Wallis test is ideal is because the data is based off of human driving behavior, which is notoriously skewed. Because of the size of the dataset, pandas and Numpy will be called. Python is being selected over SAS because Python has better visualizations (Panday, 2022).


Data Summary and Implications:

Based on the analysis of the data and the results of the Shapiro-Wilk test Man-Whitney U test, and Kruskal-Wallis test, we reject the null hypothesis(s) in favor of the alternative hypothesis(s). This means that there is evidence to suggest a significant difference between the percentage of Tesla fatalities involving 'fire' or related synonyms (14.5%) and the percentage of deaths in the U.S. population baseline of fire-related incidents (0.3%). Given the non-parametric behavior of both datasets, the tests where appropriate, yielding p-values less than an alpha level of 0.05. The conclusion aligns with the statistical findings, indicating that there is a notable difference between the two populations in terms of fatalities related to 'fire' or similar terms. This highlights the importance of further investigation and attention to safety in the context of Tesla and similar electric vehicles. Based off these findings, the implications of replacing all combustion engines with electric vehicles, would scale the number of vehicles fires up exponentially. More data needs to be compiled to monitor this trend. Lastly, this finding can now be used for a vanguard for consumer awareness.

Work Cited:
Baker, C. E., Martin, P., Wilson, M. H., Ghajari, M., & Sharp, D. J. (2022, February 12). The relationship between Road Traffic Collision Dynamics and traumatic brain injury pathology. Brain communications. https://www.ncbi.nlm.nih.gov/pmc/articles/PMC8914876/
Moosavi, S., Samavatian, M. H., Parthasarathy, S., & Ramnath, R. (2019, June 12). A countrywide traffic accident dataset. arXiv.org. https://arxiv.org/abs/1906.05409
Scipy.stats.kruskal#. scipy.stats.kruskal - SciPy v1.11.2 Manual. (n.d.). https://docs.scipy.org/doc/scipy/reference/generated/scipy.stats.kruskal.html
Scipy.stats.mannwhitneyu#. scipy.stats.mannwhitneyu - SciPy v1.11.2 Manual. (n.d.). https://docs.scipy.org/doc/scipy/reference/generated/scipy.stats.mannwhitneyu.html
Team, I. C. (2021, March 23). Python vs. R: What’s the difference? IBM Blog. https://www.ibm.com/cloud/blog/python-vs-r
Blog code in Python click here
Learn about the Flame the Sparked the investigation here: Spokane Tesla Fire 2023

Powered by Data Mining Mike: America's Data Mining Authority