

How to Fight Against Political Bribery and Government Corruption: Machine Learning the Lobbyist 2024

Abstract:
Bottom Line Up Front: While the frequency of lobbyist donations is increasing, the donation amount is random.
This study investigates the predictability of yearly lobbyist donations using a Random Forest model. The null hypothesis posits that the yearly distribution of lobbyist donations is random and unpredictable, while the alternative hypothesis suggests predictability. Leveraging a dataset sourced from Data.gov containing information on lobbyist donations from 2016 to 2024, this research aims to contribute to data analytics and taxpayer awareness by creating a Random Forest actuarial test. The analysis focuses on key variables such as 'Year', 'Net_total', 'Month', and 'Day'. Through data gathering from open-source repositories and employing data analytics tools like Python, Pandas, NumPy, and Seaborn, the study explores the relationship between independent and dependent variables. Results reveal 1,902 unique lobbyists in Washington State, top funding sources, top lobbyist recipients, peak donation months, and distribution patterns. However, despite an increasing frequency of lobbyist contributions, the 'net_total' remains random, leading to the acceptance of the null hypothesis. The findings provide insights into lobbyist money cycles and underscore the limitations of prediction using Random Forest in this context.
Research Questions:
1. How many lobbyists / lobbyist-organizations are in Washington State?
2. How many unique entities are funding lobbyists in Washington State?
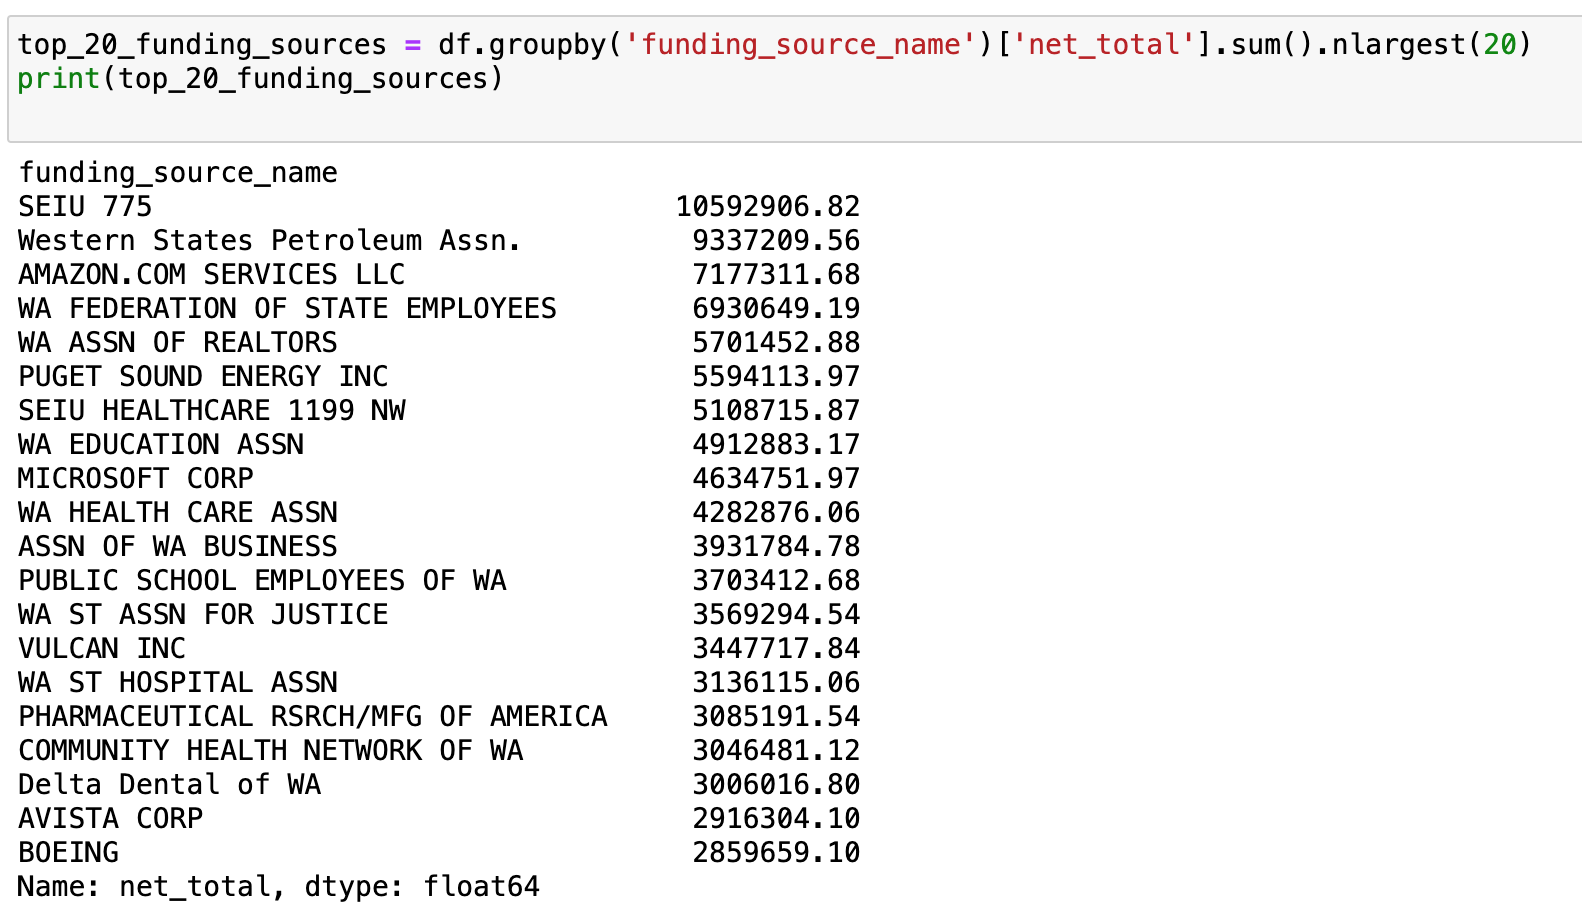
3. Identify the Top 20 sources of lobbyist money State of Washington.
4. Identify is the Top 20 lobbyist who receive money in the State of Washington.
5. Which month is the highest month for lobbyist donations?
6. Which days of the month have the highest frequency of lobbyist contributions?
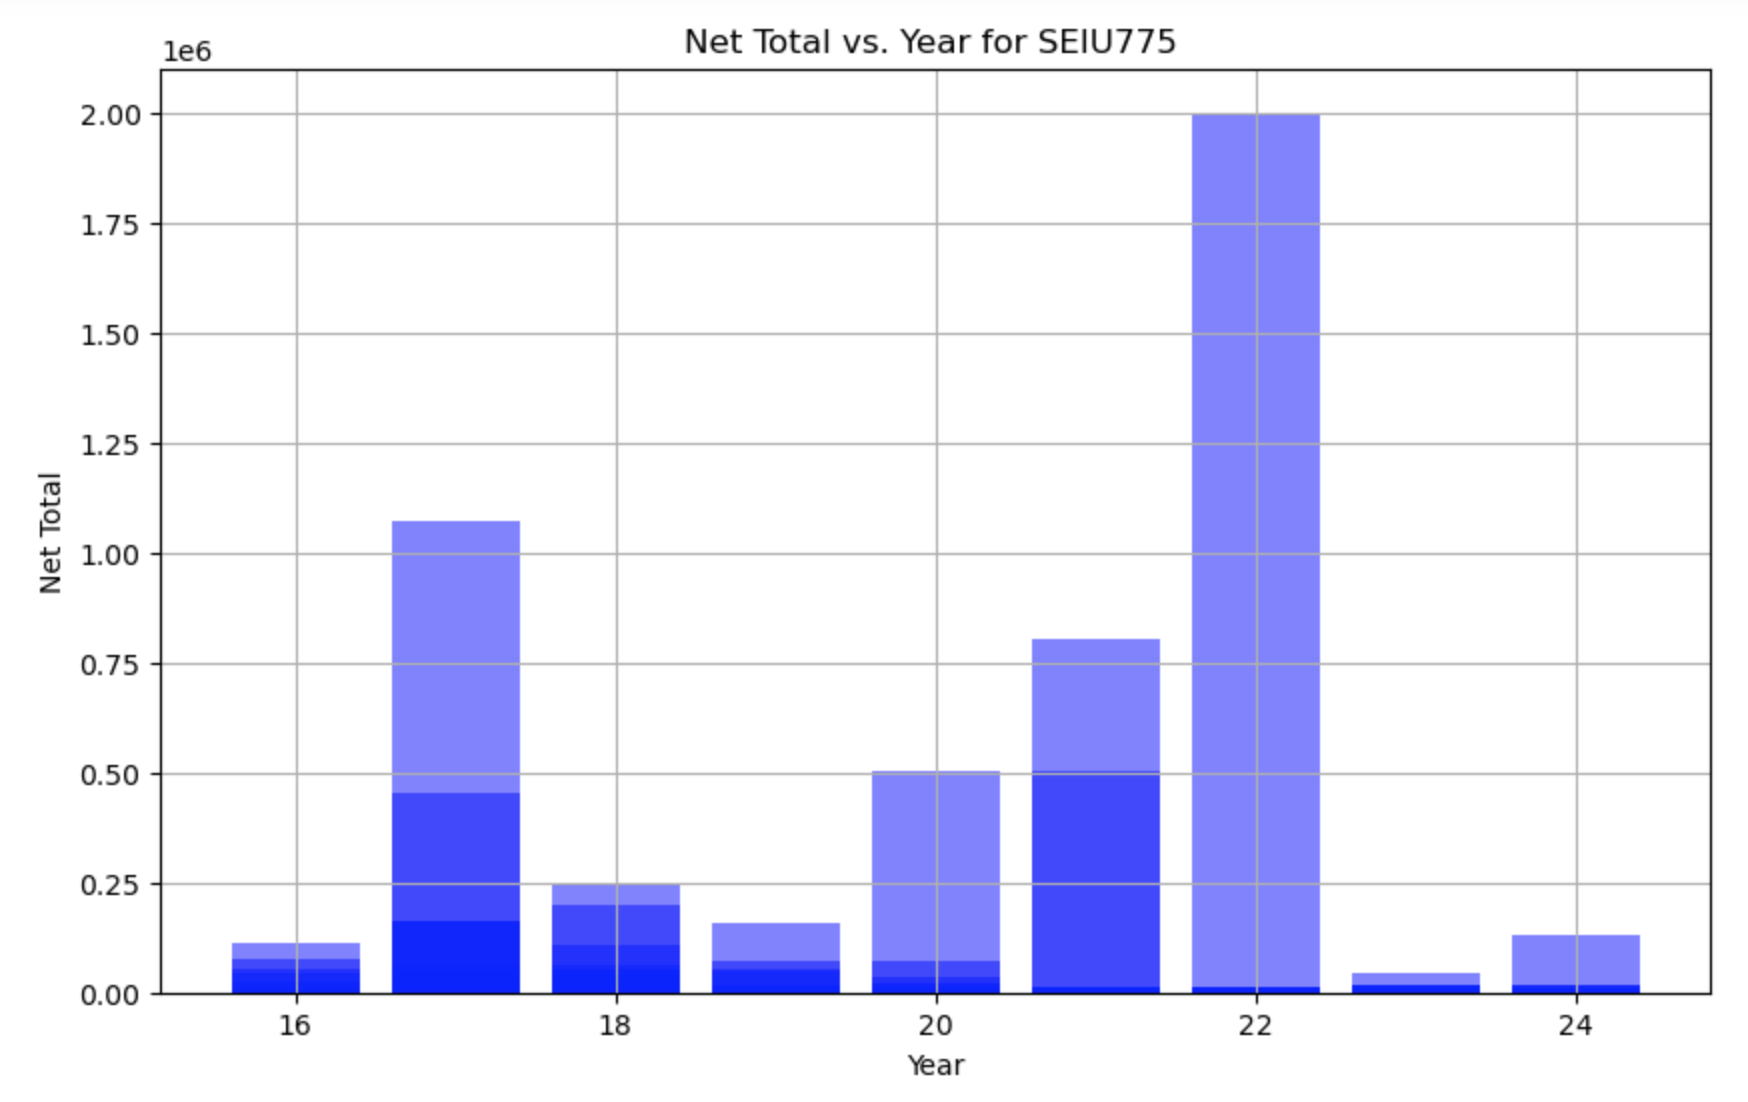
7. Graphs of select funding sources frequency distributions along a ‘Year’ timeline.
8. Is the frequency of lobbyist payments increasing, decreasing, constant, or random?
9. Is the total amount of money to lobbyists increasing, decreasing, constant, or random?
10. Can an accurate predictive Random Forest model be developed from the data?
Null Hypothesis H0:
The yearly distribution of lobbyist donations is random and not predictable.
Alternative Hypothesis H1:
The yearly distribution of lobbyist donations is predictable.

Context:
The contribution of this study to the field of Data Analytics and taxpayer awareness is to create a Random Forest actuarial test to investigate donations to lobbyists. With this information taxpayers can have a better understanding of the flow of lobbyist money and where its sourced. An article titled, Predicting Lobbying Activity in the US, showcases a study using a Random Forest test to explore engagement strength using the identical variables of: ‘Year’, ‘net_total’, ‘Month’, and ‘Day’. (CCP, 2020). They found that these variables are key factors in overall bill passing and lobbyist behavior awareness. The Random Forest is a non-parametric ensemble method that is powerful at prediction or classifying non-parametric data (Spokaneai, 2020). Understanding these variables can help describe the relationship between the Independent Variables IV and Dependent Variables DV.
Data:
For analysis, is an opensource dataset of lobbyist donations data containing the necessary variables from Data.gov. Data.gov is the opensource repository / organization that hosts the datasets. The dataset contains almost 265,988 rows (before any rows where removed) and 27 columns. The dataset is limited to only 8 years of lobbyist funding; Recorded from 2016 and going to 2024. The dataset has multiple columns for possible exploration. Different source-agents disseminate different amounts of money to lobbyist. Delimitations for this analysis, only 5 columns of the dataset will be used as they factor. The ‘Year’, ‘Net_total’, ‘filer_name’, ‘source_name’, ‘Month’, and ‘Day’; The ‘Date’ column will be parsed into separate columns. Limitations of the study size is only 8 years of data. Moreover, delimitations of the 27 IVs, only 6 will be explored.
https://catalog.data.gov/dataset/?tags=lobbyist&organization=state-of-washington
Available to the public via Data.gov, meaning that the dataset may be limiting in accuracy and completeness.
Data Gathering:
Plan and direct data gathering to opensource repositories (Google). Looking for keywords such as “Washington State”, “Lobbyist”, “Data”, “+ .csv”. Next, selecting the 1st to 3rd ranked piece of content (reachable csv file) and inspecting each csv file for quality such as “length” (at least 7k rows), data cleanliness, massive gaps in data, and enough relevant variables to create an ‘X’ and ‘Y’ axis. Available to the public via Data.gov means that it may be limiting in accuracy and completeness. In Random Forest, the dependent variable does not need to be a continuous (interval or ratio) level of measurement (Statology, 2019). Fortunately, all dependent variables are continuous. The dataset contained 36.9% redundant or repeat information before removing duplicates. All missing or null columns will be dropped when cleaning the dataset. The ‘Date’ will be separated in Python.
Data Analytics Tools and Techniques:
A KDE plot was used to visualize the distribution and visual observation was used to test for normality. Random Forest is germane to studying this data because it can handle distributions of non-parametric data. However, the Random Forest test does not assume normality in the data (Spokaneai, 2019). Overall, this is an exploratory quantitative data analytic technique and a predictive statistic. The tools used will be Jupyter Notebook operating in Python code, running sklearn api as a reliable open-source statistical library. Due to the data size, a Pandas data frame will be called, same with Numpy and Seaborn will be used for visualizations. A Random Forest test will be the statistical test used with sklearn’s Random Forest function. Additionally, presentation layers of both Univariate and by Bivariate graphs will be displayed.
Justification of Tools/Techniques:
Python will be used for this analysis because of Numpy and Pandas packages that can manipulate large datasets (IBM, 2021). The tools and techniques are common industry practice and have consensus of trust.
The technique is justified through the integer variables necessary to plot against a timeline. In so doing, may just reveal different modes of frequency distribution. Another reason why Random Forest test is ideal is because the data is based off of human-behavior, which is notoriously-skewed. Because of the size of the dataset, pandas and Numpy will be called. Python is being selected over SAS because the Python has better visualizations (Panday, 2022).

Project Outcomes:
To find statistically significant differences, the proposed end state is a Random Forest statistical forecast model that can compare the distribution shapes of the targeted groups (Statology, 2019). A visualization of the feature frequency distribution. A cleaned dataset of all the correctly labeled columns and rows, for replication. A better understanding of previously stated groups with exploratory graphs, giving support as to the forecast ability of lobbyist money cycles. Lastly, a copy of the Jupyter NoteBook with the Python code will be available, along with a video presentation added by PowerPoint. According to the same study Random was instrumental in support for alternative hypothesis, against other categorical variables. (CCP, 2020).
Get access to the code on Github here:


From the above graph, it appears like February is month with the highest frequency of lobbying instances.
According to the above graph, the number of instances for lobbying are increasing over the years of 2016 to 2024.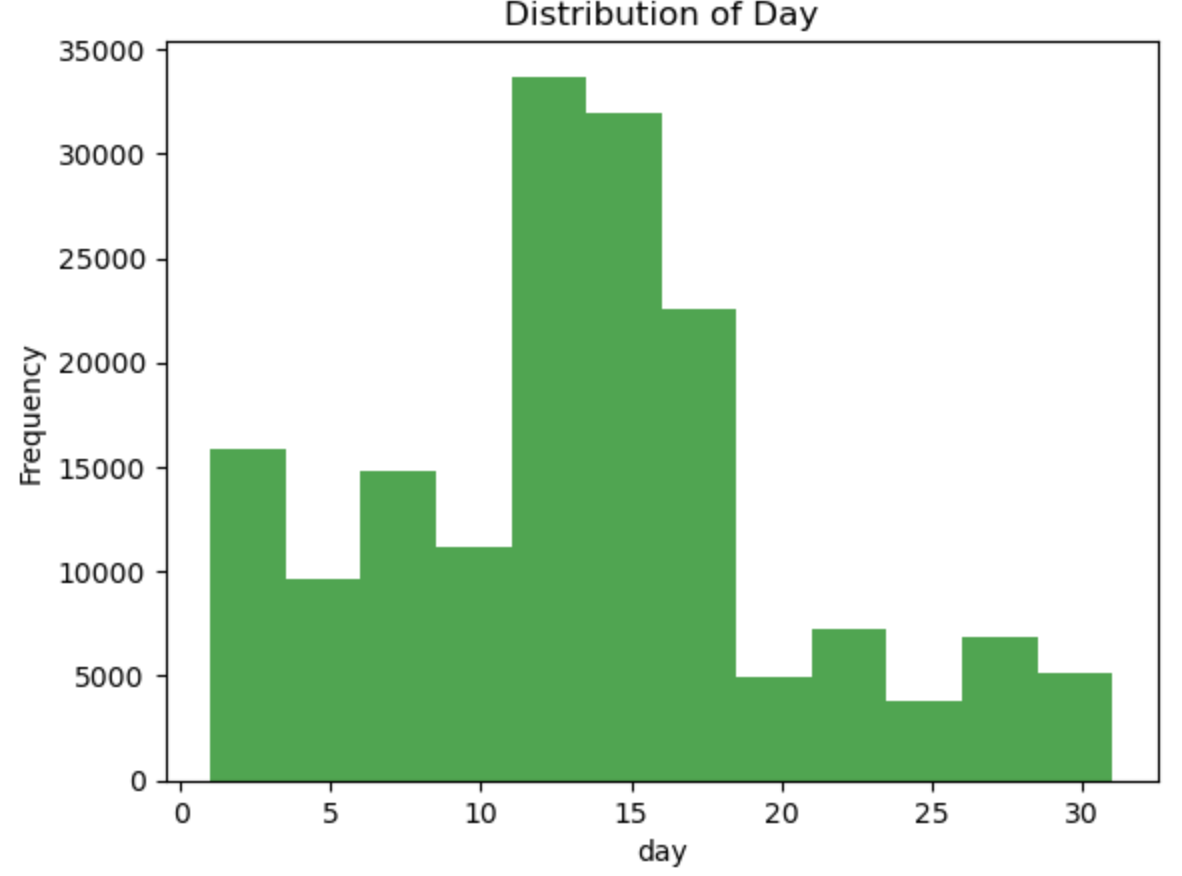
According to the above graph the highest frequency distrobutions of lobbying instances happens between the 11th and the 16th of every month. 
While the frequency distribution is increasing over the years. The distribution of ‘net_total’ is random. 
Below are the top 20 donors to lobbyist.
Below are the top 20 lobbyist whom receive money from donors.

The below Random Forest Machine Learning Model was produced to predict the ‘count’ of lobbying ‘instances_per_year’. However, the Mean Squared Error MSE is 10,352,420; A very inaccurate scoring model, considering that the MSE should be as close to ‘0’ as possible. An identical Random Forest was used to predict the ‘net total’ per ‘Year’; However, that model yielded a very inaccurate score as well, but reenforces the random distribution of ‘net total’.


Now exploring how much Microsoft gives to lobbyist per year.

Now exploring how much the Washington Federation of State Employees donates to lobbyist per year.


In Final Analysis,
This study has yielded valuable insights into the dynamics of lobbyist donations in Washington State. Analysis of the dataset reveals a diverse landscape with 1,902 unique lobbyists or lobbyist organizations actively engaged in the state's political arena. Furthermore, examination of the data uncovers 3,682 unique entities funding these lobbyists, shedding light on the breadth of interests influencing political decision-making.
Identification of the top 20 sources of lobbyist money in Washington State provides clarity on the key players driving political influence. Similarly, the identification of the top 20 lobbyists who receive money underscores the interconnected nature of lobbying activities.
Analysis of donation patterns by month reveals February as the peak month for lobbyist donations, suggesting potential strategic considerations or legislative activities during this period. Moreover, a narrower window of donation distribution between the 11th and 16th of each month highlights the concentrated timing of financial contributions within each month.
Visualizations depicting the frequency distributions of select funding sources along a 'Year' timeline provide a comprehensive overview of donation trends over time. Notably, an increasing frequency distribution of lobbyist contributions is observed, indicating a growing level of lobbying activity in recent years.
However, despite the observed increase in frequency, the analysis reveals that the 'net_total' of lobbyist donations does not exhibit a corresponding increase over time. Instead, it remains random, suggesting fluctuations and inconsistencies in the overall financial contributions made by lobbyists.
As a result, the study concludes that based on the random distribution of the 'net_total', the predictive capability of a Random Forest model to forecast 'net_total' per year is limited. This finding underscores the complexity and unpredictability inherent in the realm of lobbyist donations, highlighting the challenges associated with modeling such behaviors. Despite the limitations, the study provides valuable insights into lobbyist money cycles and serves as a foundation for further research in the field of political finance and data analytics. In closing, the research yielded these answers to the research questions:

1. There are 1,902 unique lobbyists / lobbyist organizations in Washington State.
2. There are 3,682 unique entities funding the lobbyists.
3. Identified the top 20 sources of lobbyist money State of Washington.
4. Identified is the top 20 lobbyist who receive money in the State of Washington.
5. February is the highest month for lobbyist donations.
6. The days that the lobbyist money is distributed is between the 11th -16th of each month.
7. The Graph of select funding sources frequency distributions along a ‘Year’ timeline.
8. The frequency distribution of the lobbyist contributions is increasing.
9. At the same time, the ‘net_total’ is not increasing with the frequency but remaining random.
10. Therefore, based on the random distribution of the 'net_total', the ability to predict ‘net_total’ per year is not possible with the Random Forest and led to accept the Null Hypothesis.
Work Cited:
Data.gov home - data.gov. Catalog. (n.d.-a). https://catalog.data.gov/dataset/?tags=lobbyist&organization=state-of-washington
Data.gov home - data.gov. Catalog. (n.d.-b). https://catalog.data.gov/dataset/?tags=lobbyist&organization=state-of-washington
How much can you contribute to a political campaign in 2023?. Artificial Intelligence. (2024, April 22). https://spokaneai.io/2024/04/21/how-much-can-you-contribute-to-a-political-campaign-in-2023/
Pandey, Y. (2022, May 25). SAS vs python. LinkedIn. https://www.linkedin.com/pulse/sas-vs-python-yuvaraj-pandey/
Predicting Lobbying Activity. (n.d.). https://ueaeco.github.io/working-papers/papers/ccp/CCP-05-09.pdf
Team, I. C. (2021, March 23). Python vs. R: What’s the difference? IBM Blog. https://www.ibm.com/cloud/blog/python-vs-r
