

How to Hack Instagram Engagement; Unveiling Data-Driven Insights in 2023

Abstract
This research delves into the dynamics of Instagram engagement with a focus on optimizing content upload strategies. The study addresses six critical questions concerning the temporal and thematic aspects of Instagram engagement. Two datasets, one extensive covering over a decade of Instagram data (2010-2021) and the other, more recent, comprising trending tech influencer data in 2023, serve as the foundation for this exploration. All timestamps are standardized to Zulu time (Greenwich, England).
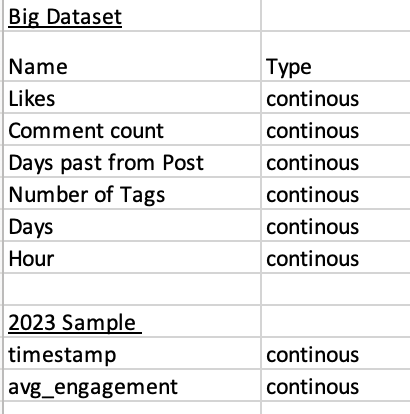
The larger dataset contains variables including 'Likes,' 'Comment count,' 'Days past from post,' 'Number of Tags,' 'Day,' and 'Hour.' Meanwhile, the smaller dataset is limited to 'timestamp' and 'avg_engagement.' Python programming is employed for analysis, with a primary emphasis on big data.
The findings offer insights into the optimal upload times for Instagram content. Notably, the study identifies the time window of 0500-0800 Zulu (9-12 PST) as the peak engagement period, surpassing other hours significantly. Furthermore, it reveals that hashtags, while relevant, exhibit diminishing returns as their count increases.
Regarding content longevity, the study unveils a non-linear pattern, suggesting content engagement peaks around the 700-day mark. Contrary to expectations, no specific 'day of the week' emerges as optimal for uploads. However, the data suggests that the 20th to the 31st of each month garners the highest commenting engagement. Interestingly, odd-numbered months, especially July, stand out as the most favorable for content uploads.
In conclusion, this study challenges the null hypothesis that Instagram engagement is random, providing compelling evidence of structured patterns. These insights enable media companies and content creators to strategically time their uploads for maximum impact. The research contributes to the field of Data Analytics, enhancing understanding of engagement dynamics on Instagram. Comparative studies in the field further validate the significance of metrics such as 'Likes,' 'Views,' and 'Comment Count' in gauging content engagement (GATR, 2020; Grubich, 2023).
Keywords: Instagram engagement, upload times, hashtags, content longevity, data analysis, data sets, Zulu time, social media, content strategy, data analytics.
Research Question(s):
1 What time window(s) is best to upload a video for maximum engagement to Instagram?
2 How do hashtags factor into engagement on Instagram?
3 How long will content take to reach the maximum engagement on Instagram?
4 What ‘day of the week’ is best to upload to Instagram?
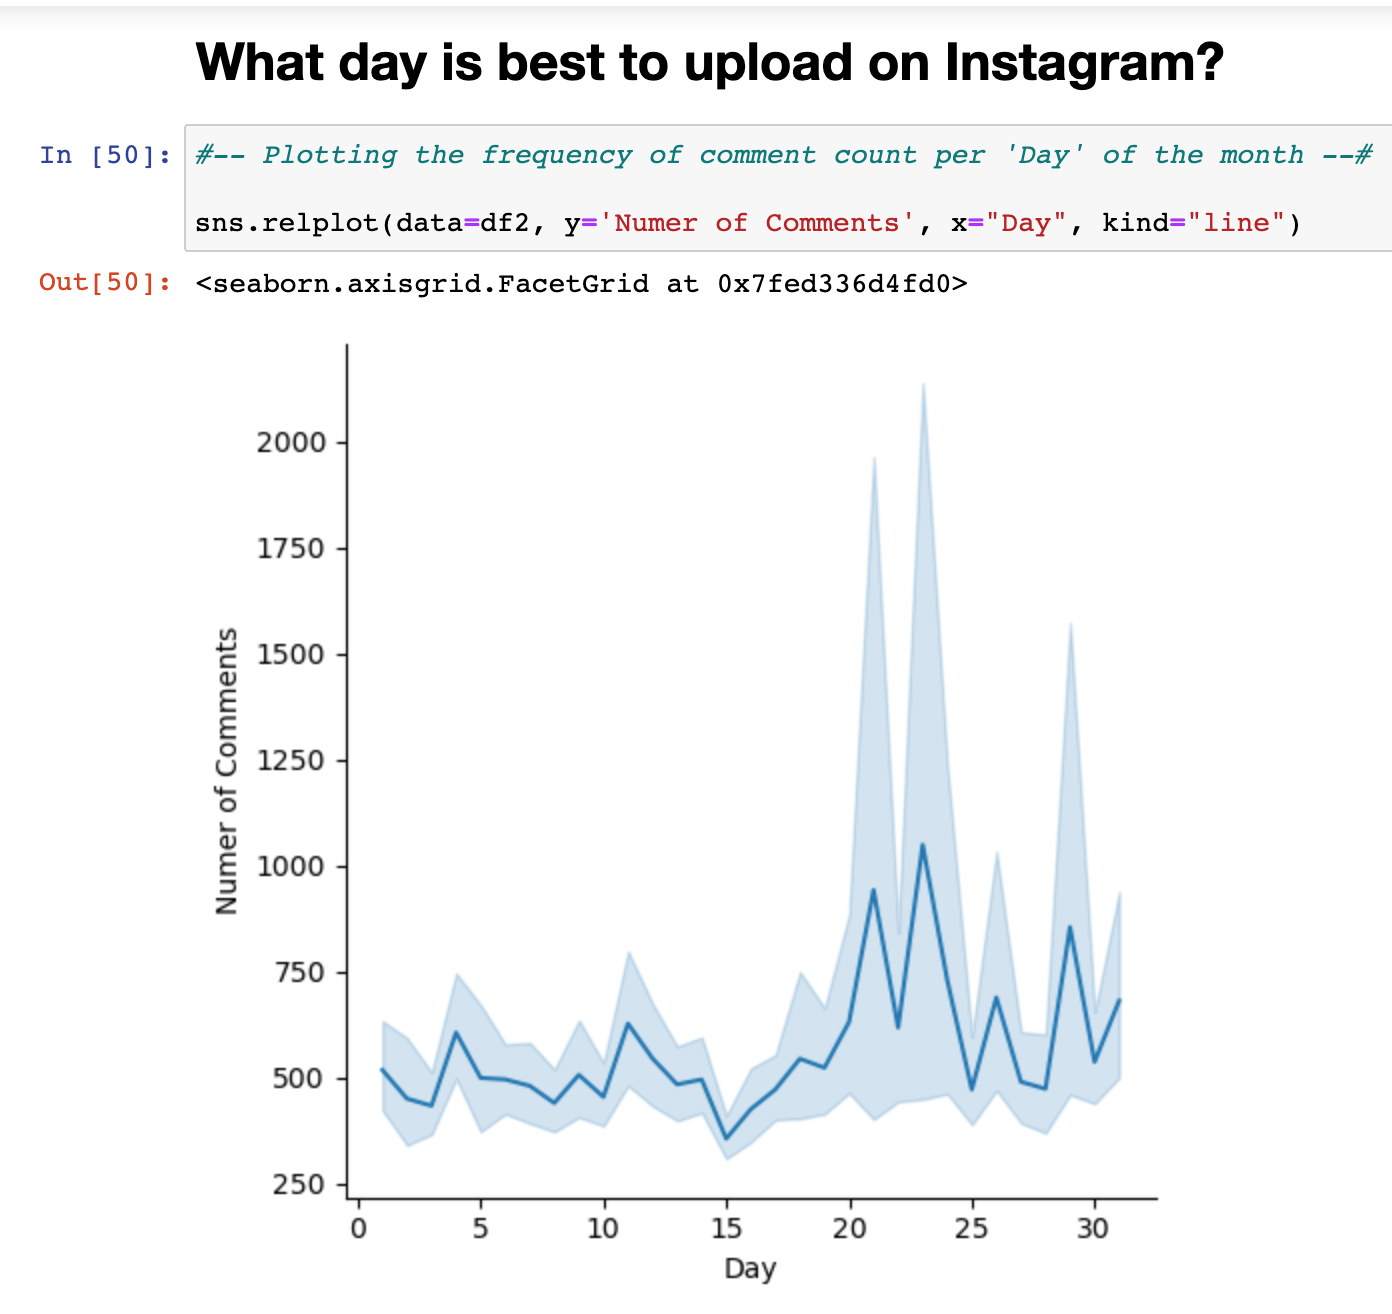
5 What ‘day of the month’ is best to upload to Instagram?
6 What ‘month(s)’ are best to upload to Instagram?
Null Hypothesis H0:
The distribution of viewer engagement is random.
Alternative Hypothesis H1:
The distribution of viewer engagement is not random.
Context:
The contribution of this study to the field of Data Analytics and industry intelligence is to investigate prime upload hours on Instagram; Concurrently exploring other variables of interest to answer the research questions. With this information a media company can maximize the investment put into the video content. An article titled, Brand Engagement in Light of Post Content Type on the Facebook Platform in the Selected Industry, showcases a study using statistical testing to explore engagement strength using the identical variables of ‘Likes’, ‘Views’, and ‘Comment Count’ (GATR, 2020). They found that these variables are key factors in overall content engagement and brand awareness. A similar big-data study titled, When is the Best Time to Upload to YouTube in 2023, also compared engagement metrics of ‘Likes’, ‘Comment_count’, and ‘Timestamp’; Finding these variables are paramount for engagement-feature exploration (Grubich, 2023).
Data:
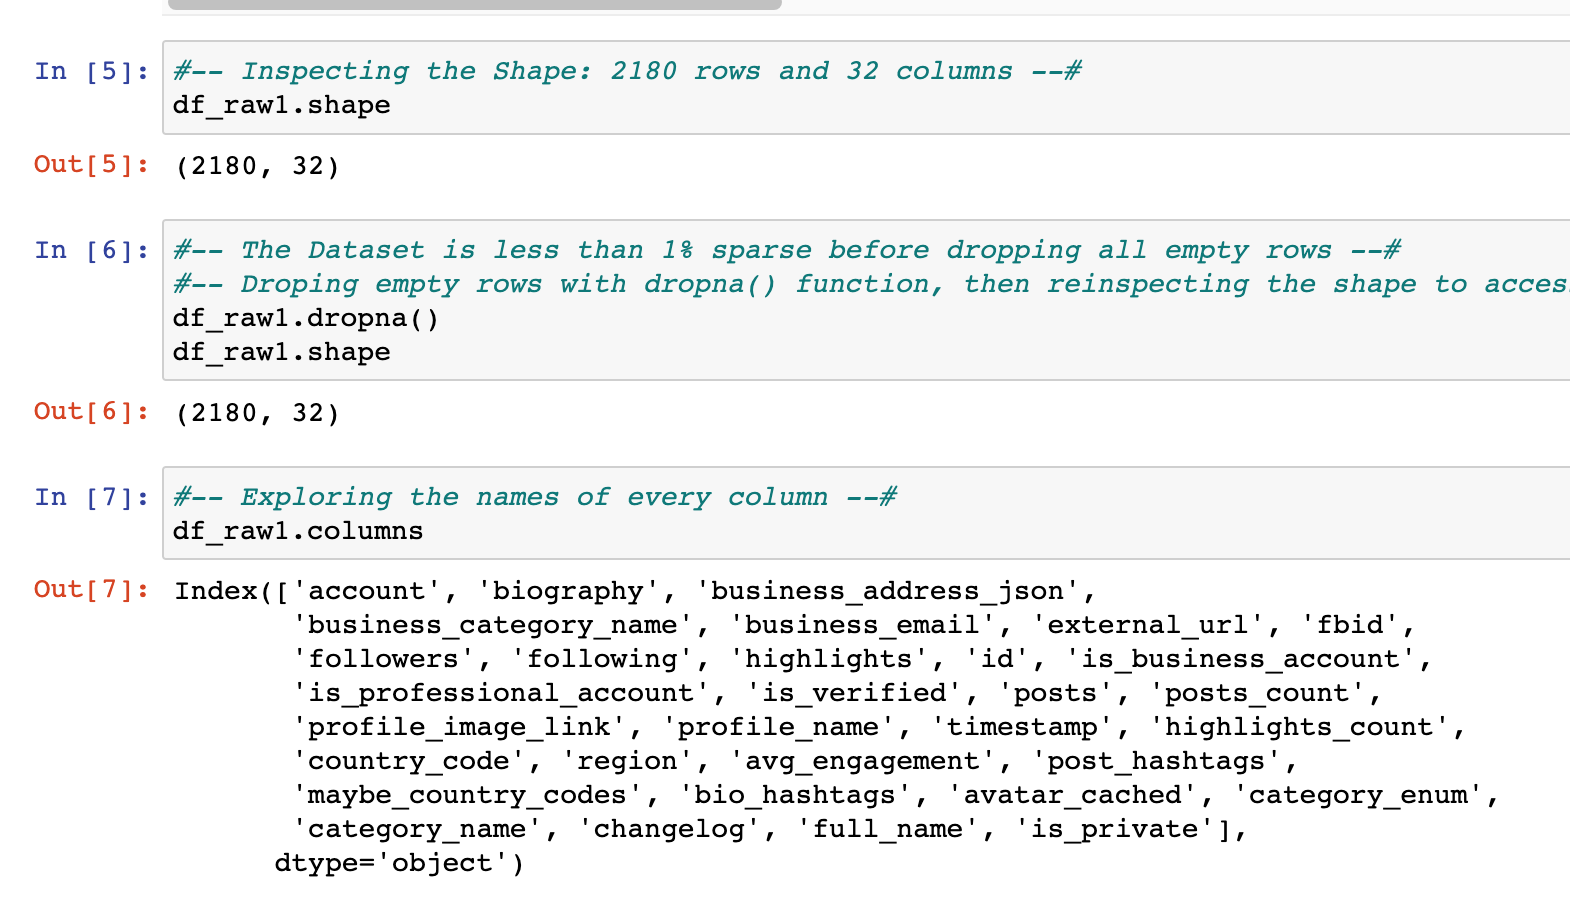
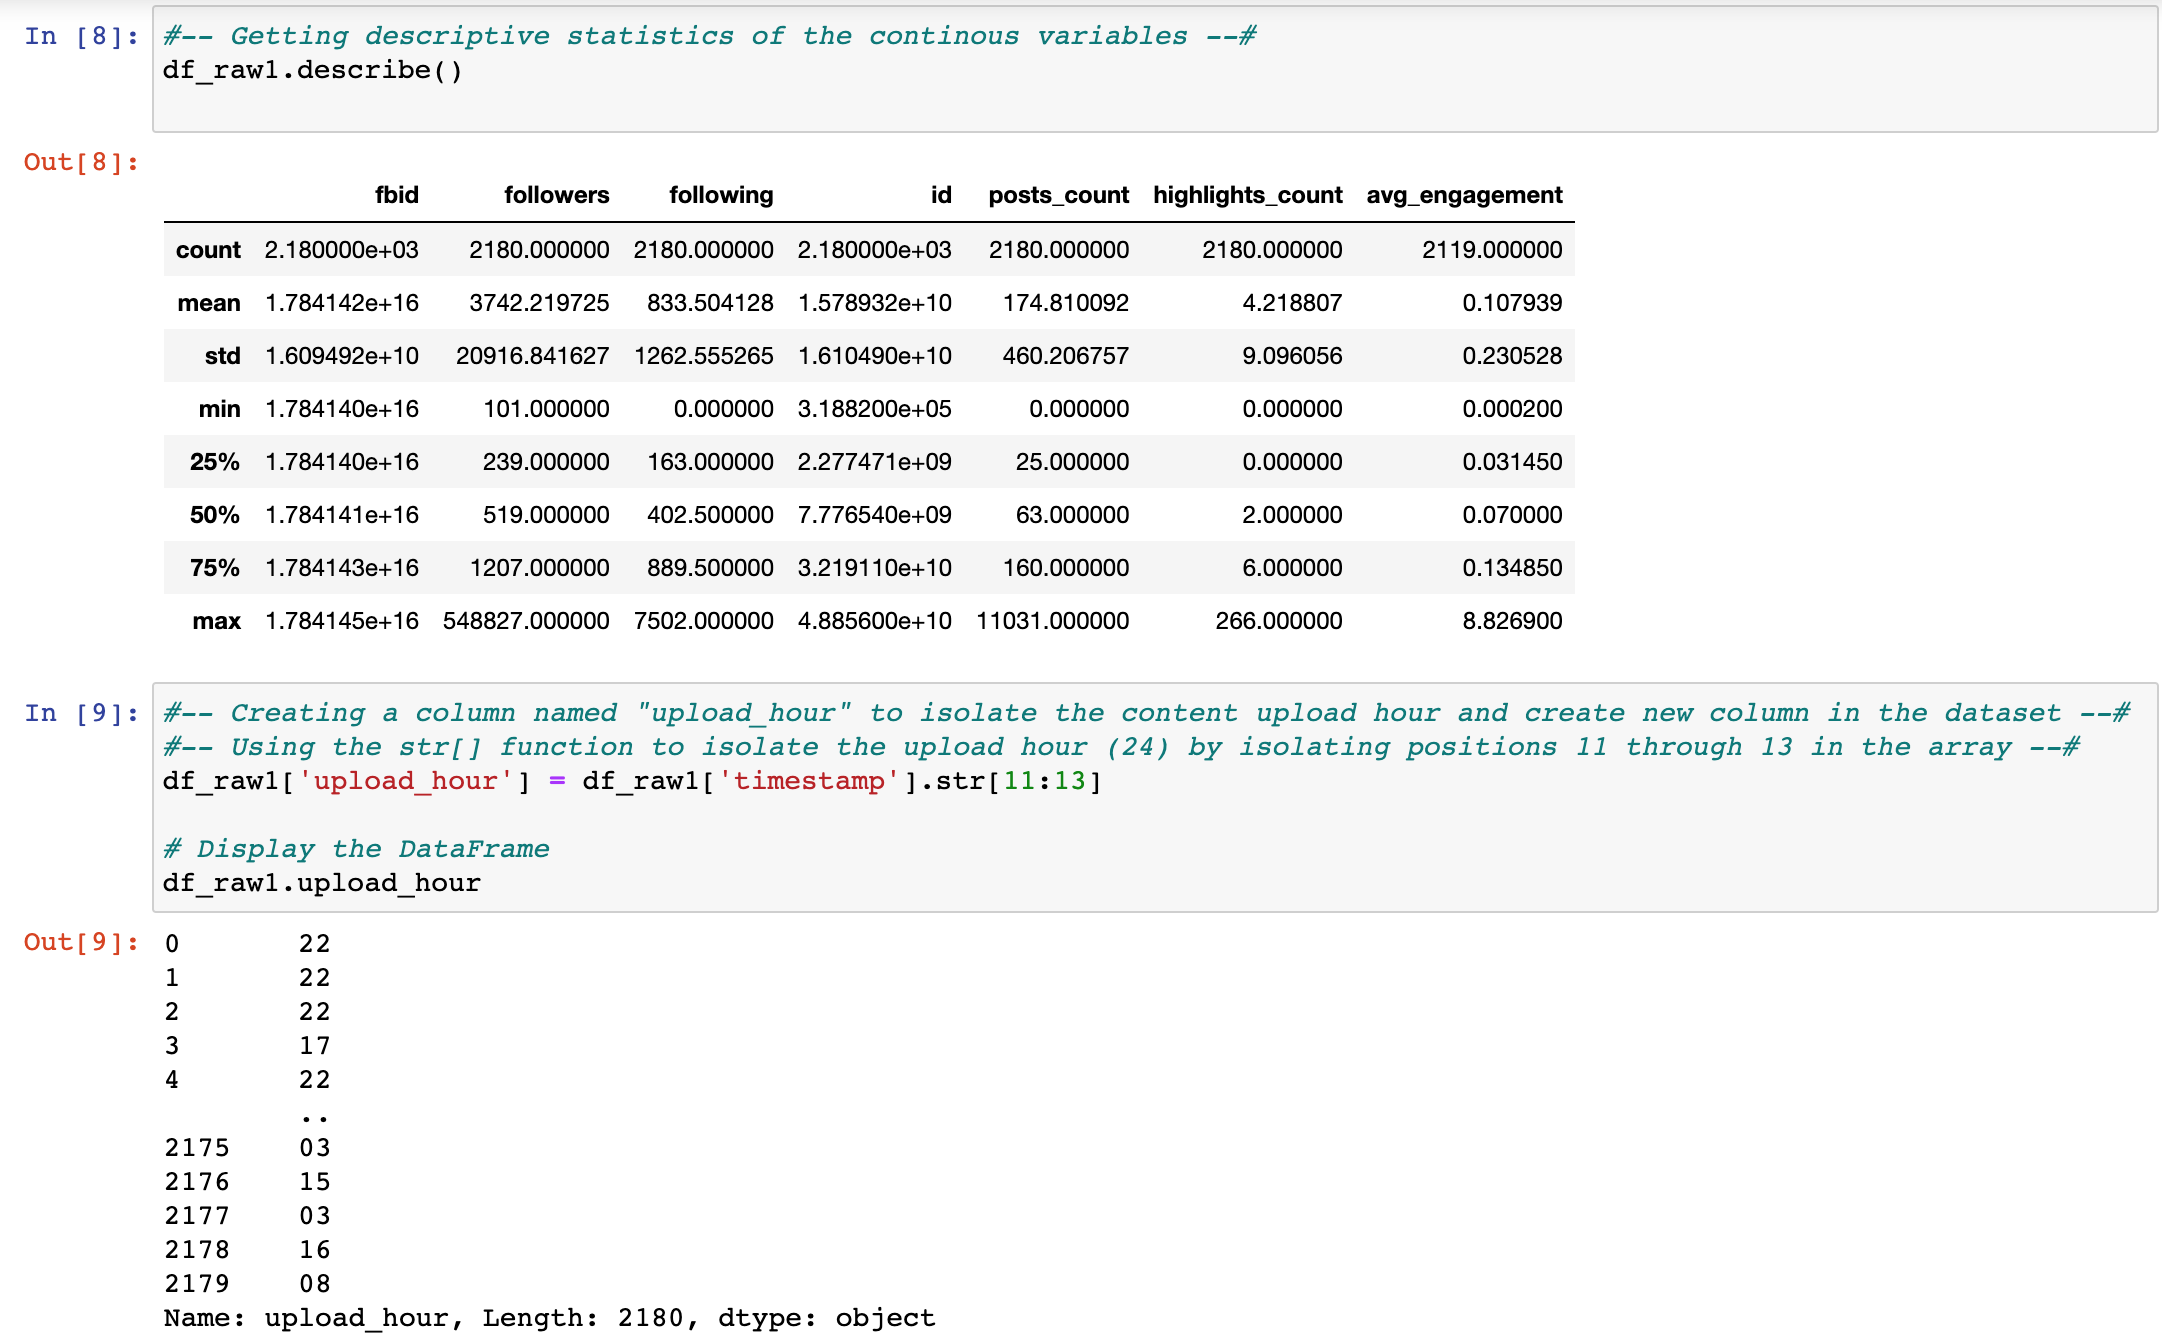
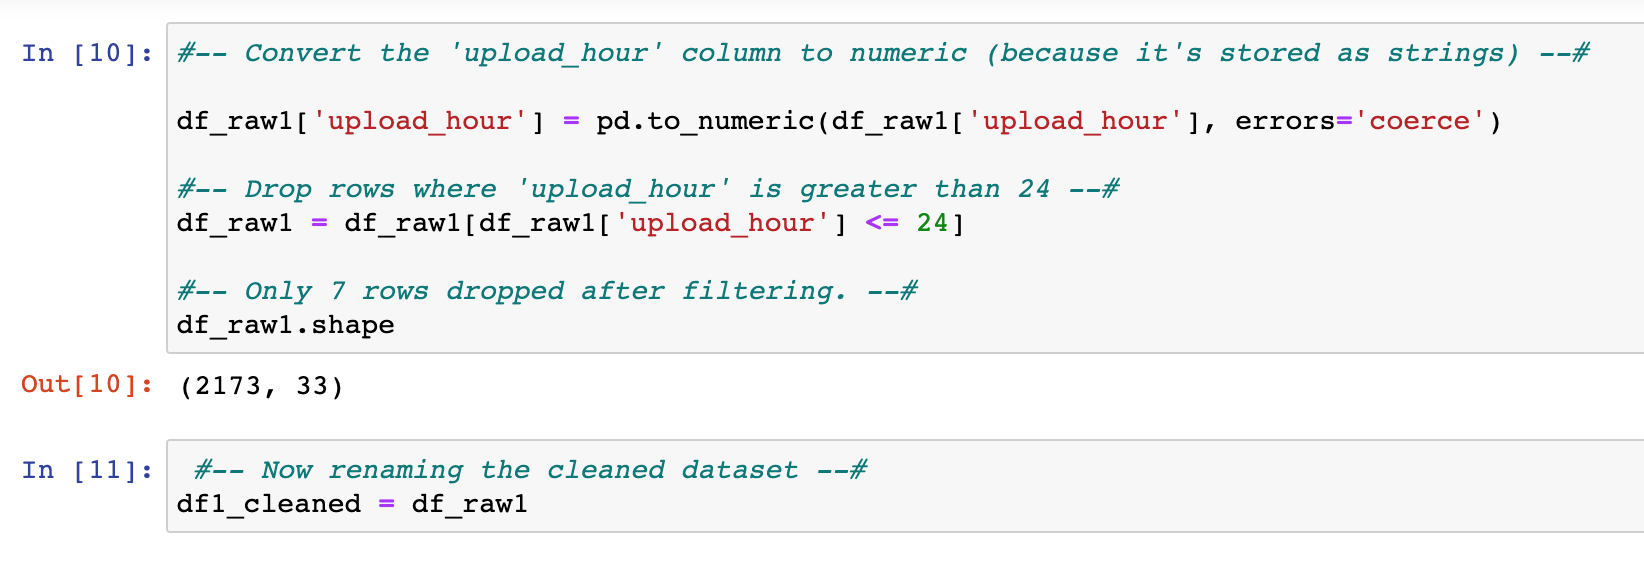
An opensource dataset(s) of YouTube data containing the necessary variables about video uploads. A Kaggle dataset from www.kaggle.com. Kaggle is the opensource repository / organization that hosts the datasets. The first dataset contains almost 2,173 rows (before any rows where removed) and 33 columns. The dataset is limited to only 6 months of YouTube’s trending videos; Uploaded 2023 meaning that it is more relevant compared to the second dataset. The dataset has multiple columns for possible exploration with variables that are germane to the exploration. Different audiences watch shows at different time-zones all over the planet. Delimitations for this analysis, only 3 columns of the relevant dataset will be used as they factor into engagement: The ‘timestamp’, and ‘avg_engagment’. The dataset is easy to work with because the columns with whole integer values. The ‘timestamp’ is in 24hour timestamp indexed on Zulu time (located in England). The time will need to be separated from the date. One limiting factor of this dataset is the unknown composition behind the variable ‘avg_engament’; Another limiting factor is that ‘avg_engagment’ is the only engagement metric for comparison for this dataset. The dataset can be found here:
https://www.kaggle.com/datasets/joebeachcapital/instagram-coders
Available to the public via Kaggle.com, meaning that the dataset may be limiting in accuracy and completeness. The second dataset is 178,922 rows and 13 columns. It covers 10 years of trending Instagram content with upload times. The dataset has ‘likes’, ‘comment count’, ‘days past from post’, ‘day’, ‘number of tags’, ‘days past upload’, ‘day’, and ‘hour’. It has numerous columns for exploration and two variables that can be engineered into a more refined engagement metric ‘likes’ can be filtered through the ‘number of comments’; Yielding a more descriptive metric called Engagement Per Like EPL. The dataset can be found here:
https://www.kaggle.com/datasets/vasileiosmpletsos/1100-instagram-users-datetime-posts-data
Data Gathering:
Plan and direct data gathering to opensource repositories (Google). Looking for keywords such as “Instagram”, “upload times”, “+ .csv”. Next, selecting the 1st to 3rd ranked piece of content (reachable csv file) and inspecting each csv file for quality such as “length” (at least 7k rows combined), data cleanliness, massive gaps in data, and enough relevant variables to create an ‘X’ and ‘Y’ axis. Another consideration was finding two datasets, (1) big and (1) pertinent to compare the differences. Available to the public via Kaggle.com means that it may be limiting in accuracy and completeness. Fortunately, all dependent variables are continuous. The relevant set is 0.01% sparse and all missing or null columns will be dropped when cleaning the dataset. The ‘upload_time’ will be separated from the date into separate column of upload hours for the smaller dataset. The large set is 0% sparse and requires no complex feature engineering.
Data Analytics Tools and Techniques: A seaborn and Matplotlib are used to populated the distribution visualizations. Overall, this is an exploratory quantitative data analytic technique and a descriptive statistic. The tools used will be Jupyter Notebook operating in Python code, running statsmodel api as a reliable open-source statistical library. Due to the data size of the larger set, a Pandas data frame will be called, same with Numpy and Seaborn will be used for visualizations. Presentation Layer – Univariate and by Bivariate graphs.
Justification of Tools/Techniques:
Python will be used for this analysis because of Numpy and Pandas packages that can manipulate large datasets (IBM, 2021). The tools and techniques are common industry practice and have consensus of trust.
The technique is justified through the integer variables necessary to plot against a timeline. In so doing, may just reveal different modes of frequency distribution. Human viewing behavior is notoriously skewed. Because of the size of the dataset, pandas and Numpy will be called. Python is being selected over SAS because the Python has better visualizations (Panday, 2022).
Project Outcomes: In order to, find statistically significant differences, the proposed end state is a visualization of the frequency distribution of the engagement metrics against a 24hr scaled timeline, indexed at Zulu time. A cleaned dataset of all the correctly labeled columns and rows, for replication. A better understanding of previously stated groups with exploratory graphs, giving support as to what time engagement maybe highest. Lastly, a copy of the Jupyter NoteBook with the Python code will be available here: Instagram Engagement Time Code, along with a video presentation.

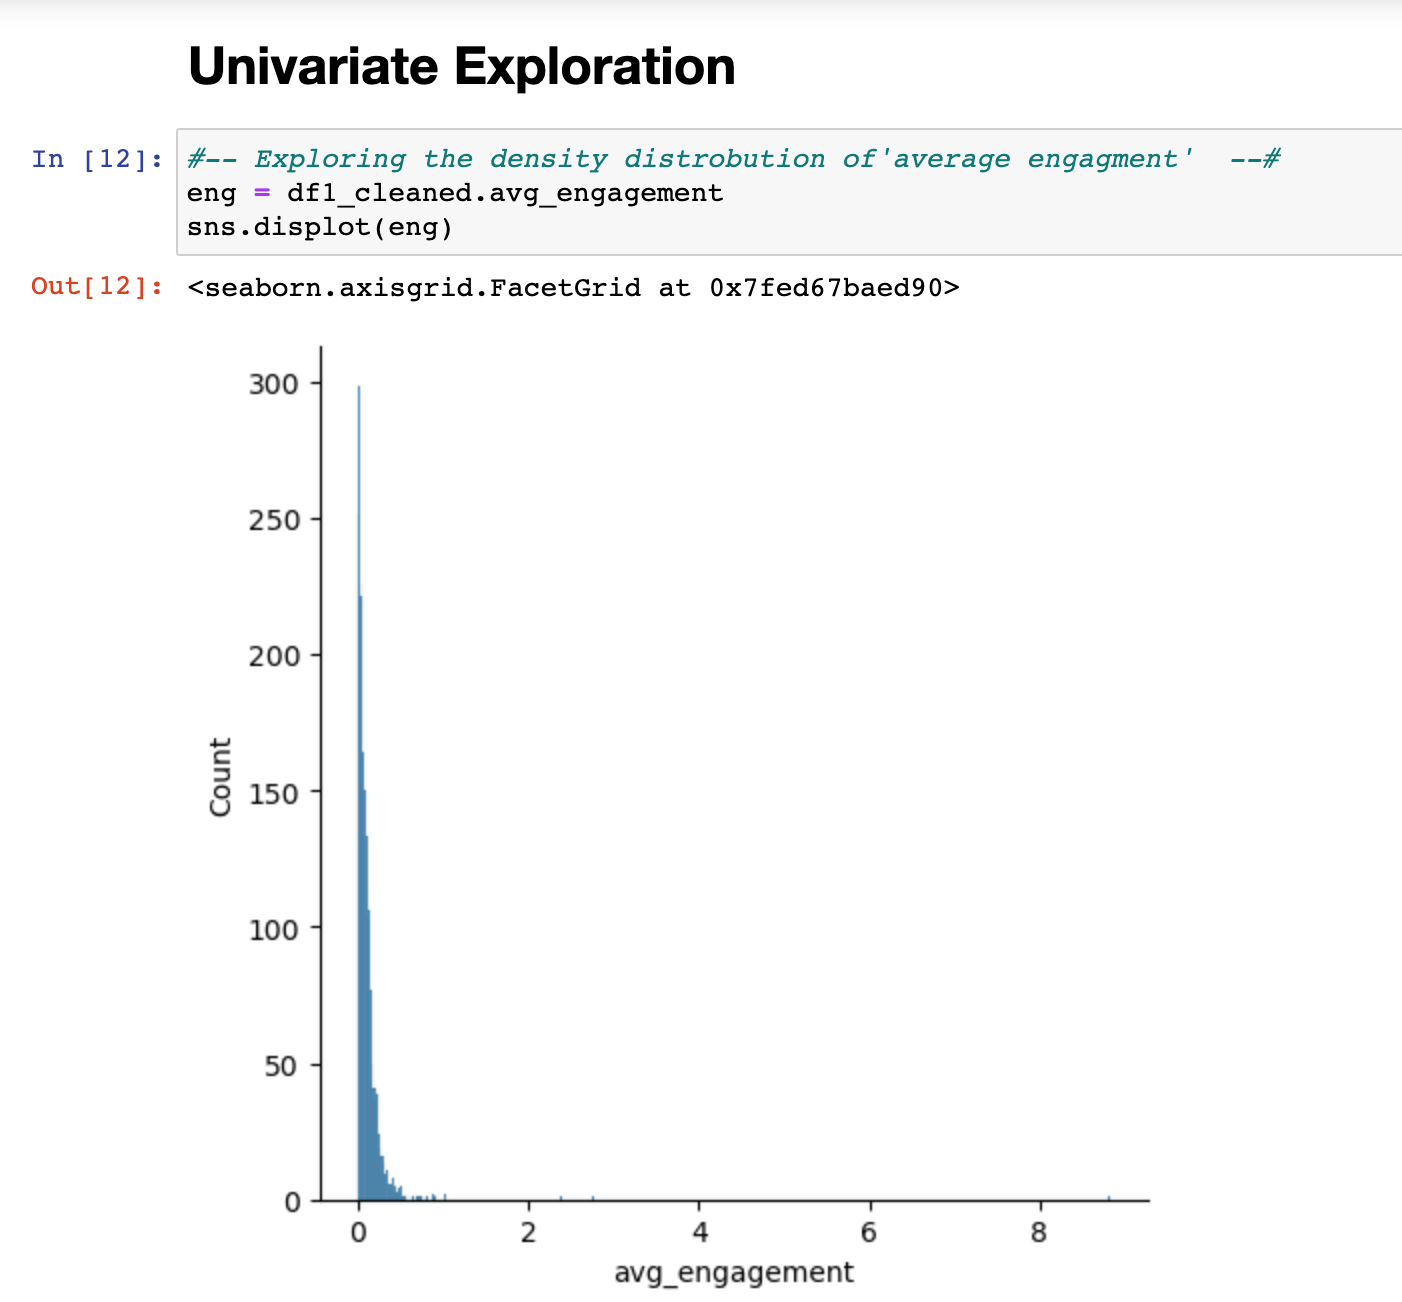
The distribution of avg_engagment appears to be ‘Left-Skewed’.

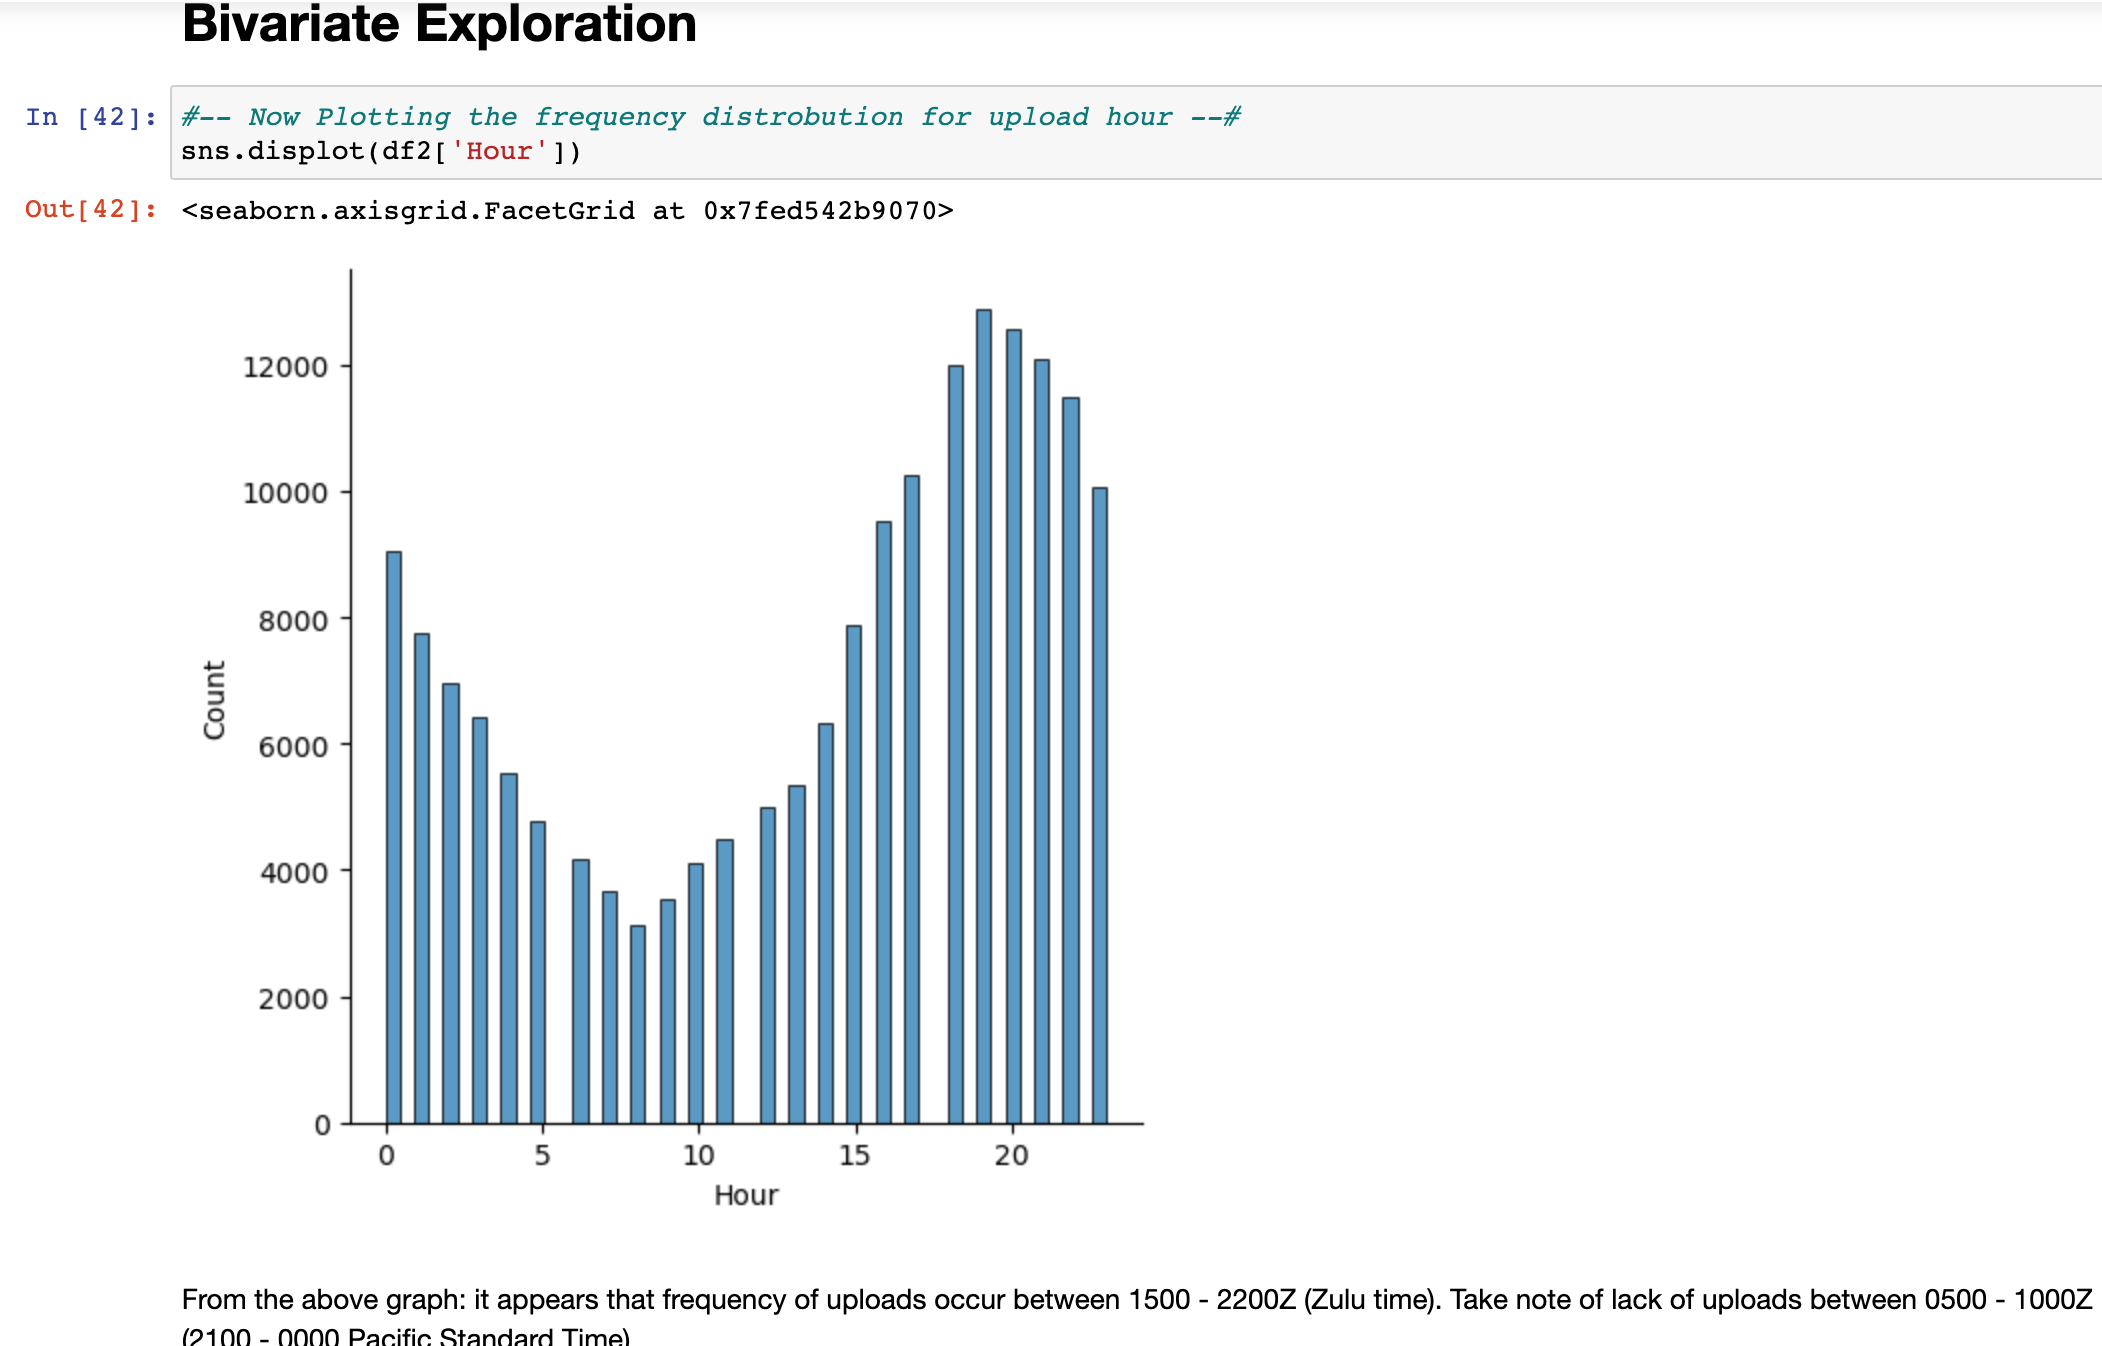
When plotting the frequency counts of content uploads vs. 'upload_hour', there appears to be three bins in 2 hour incriments. The bin 1600-2400z with 2300-2400z being the highest count.


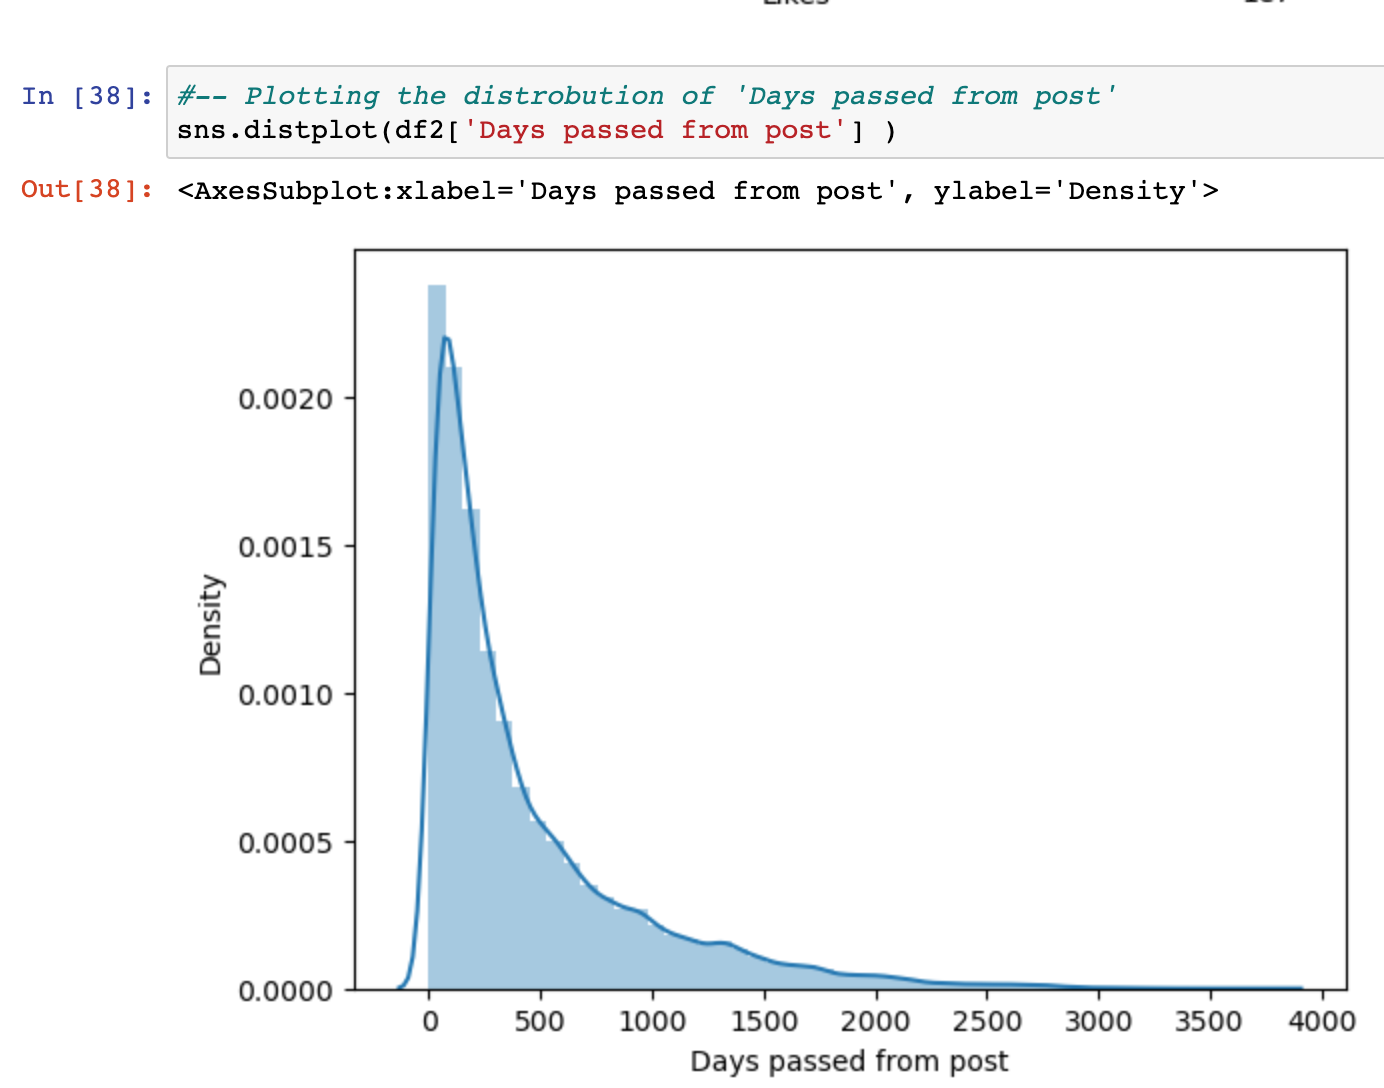


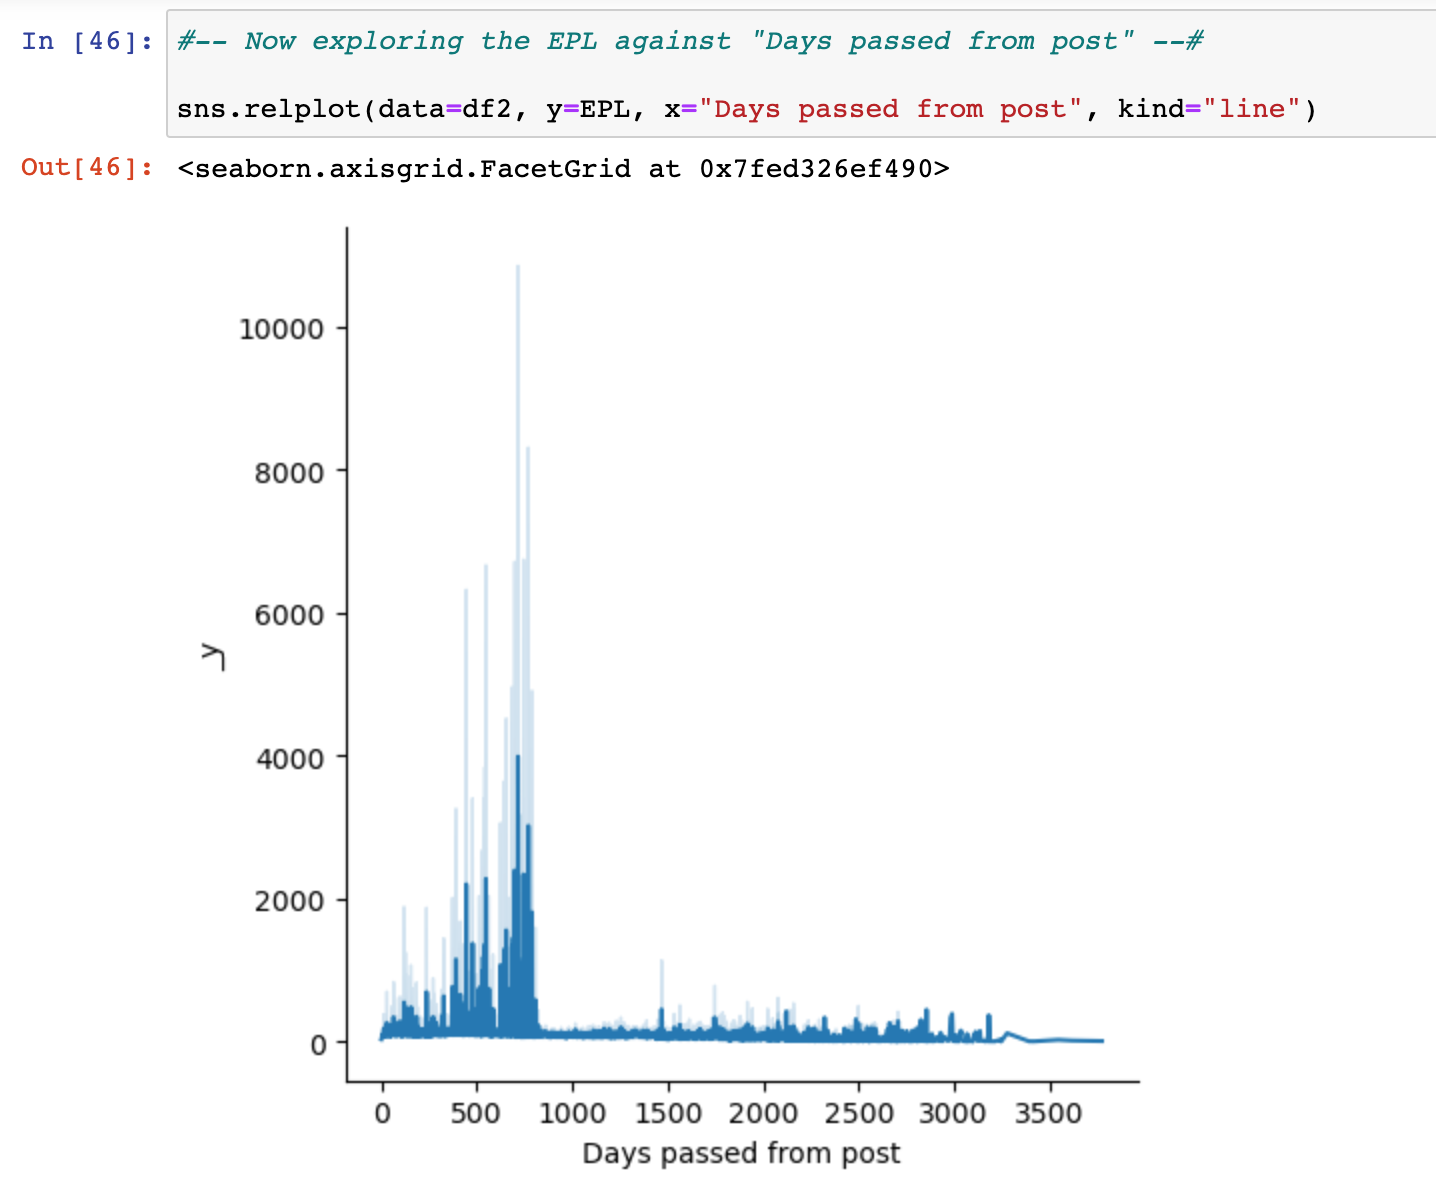
The above graph shows in that content engagement peaks and drops dramatically after the 600-800 day mark. The distrobution seems to imply that engaging content, will be 'more engaged with' approximently with in 300 - 500 days after upload.
The 300-500-day window seems to double in engagment then double again at the 700-day mark
Additionally, the highest amount of enegagement will occur at approximently the 700-day mark.
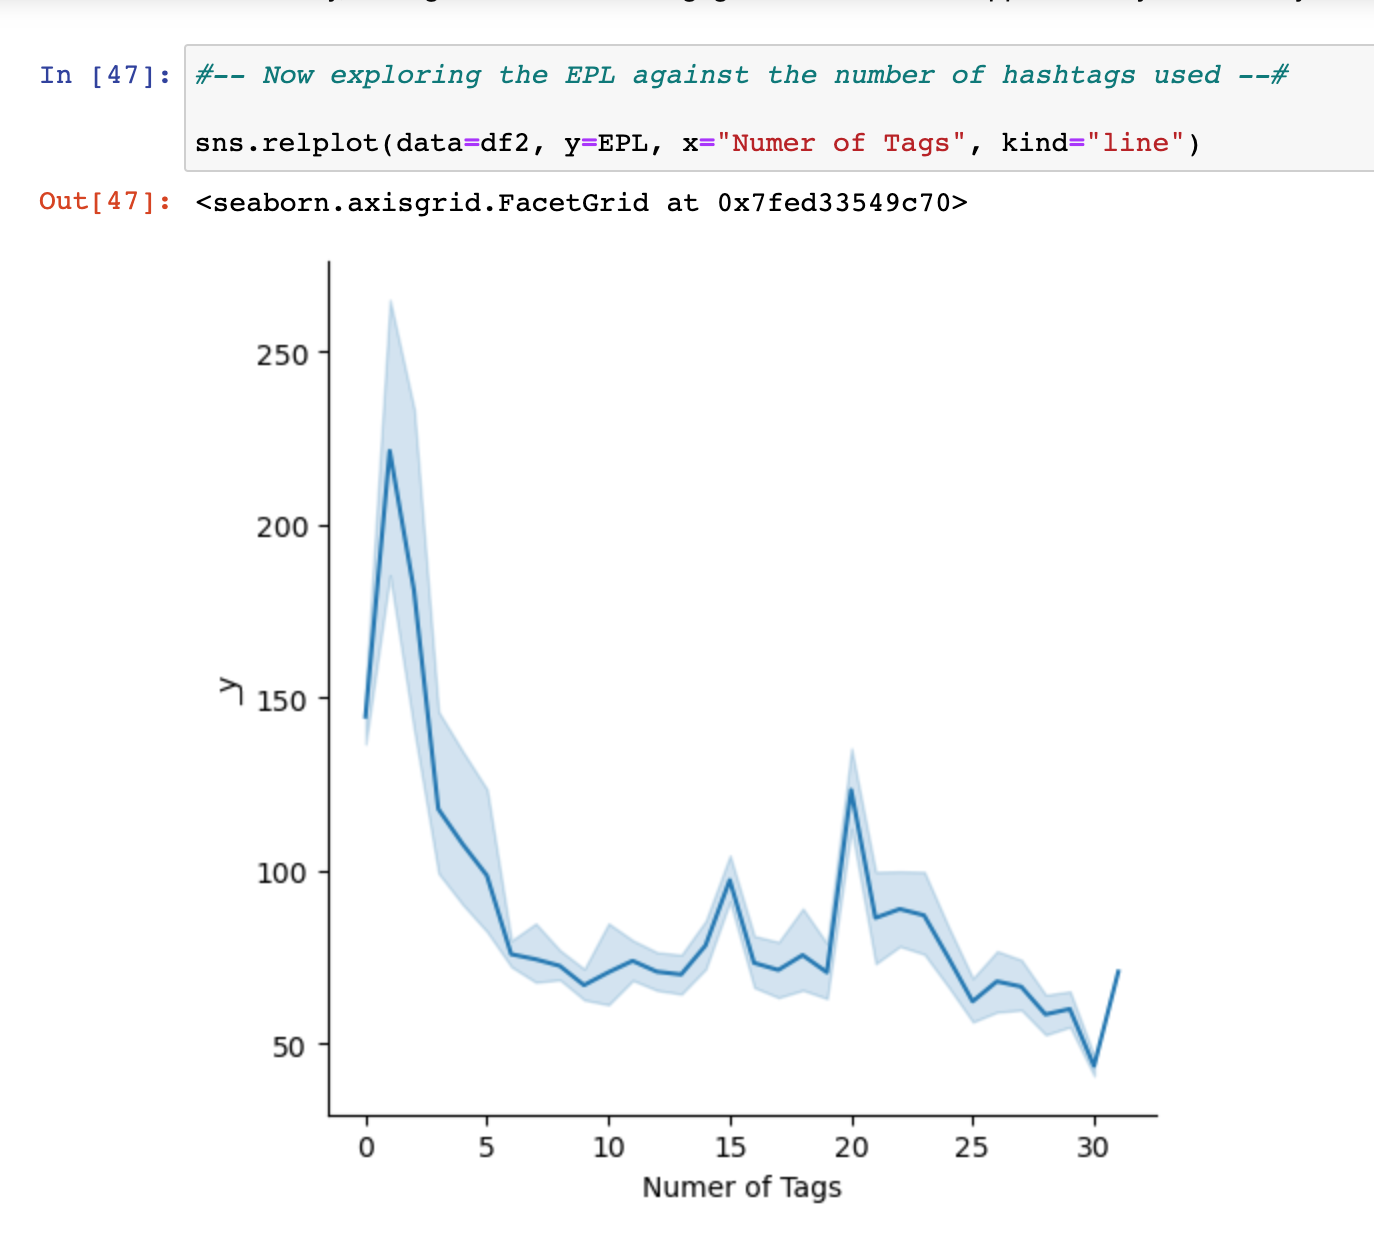
The above graph indicates that Engagement Per Like is ‘higher’ when the ‘Number of tags’ is near ‘1’. Zero tags are better than ‘2’ or more.


In final analysis,
1. What time window(s) is best to upload a video for maximum engagement to Instagram?
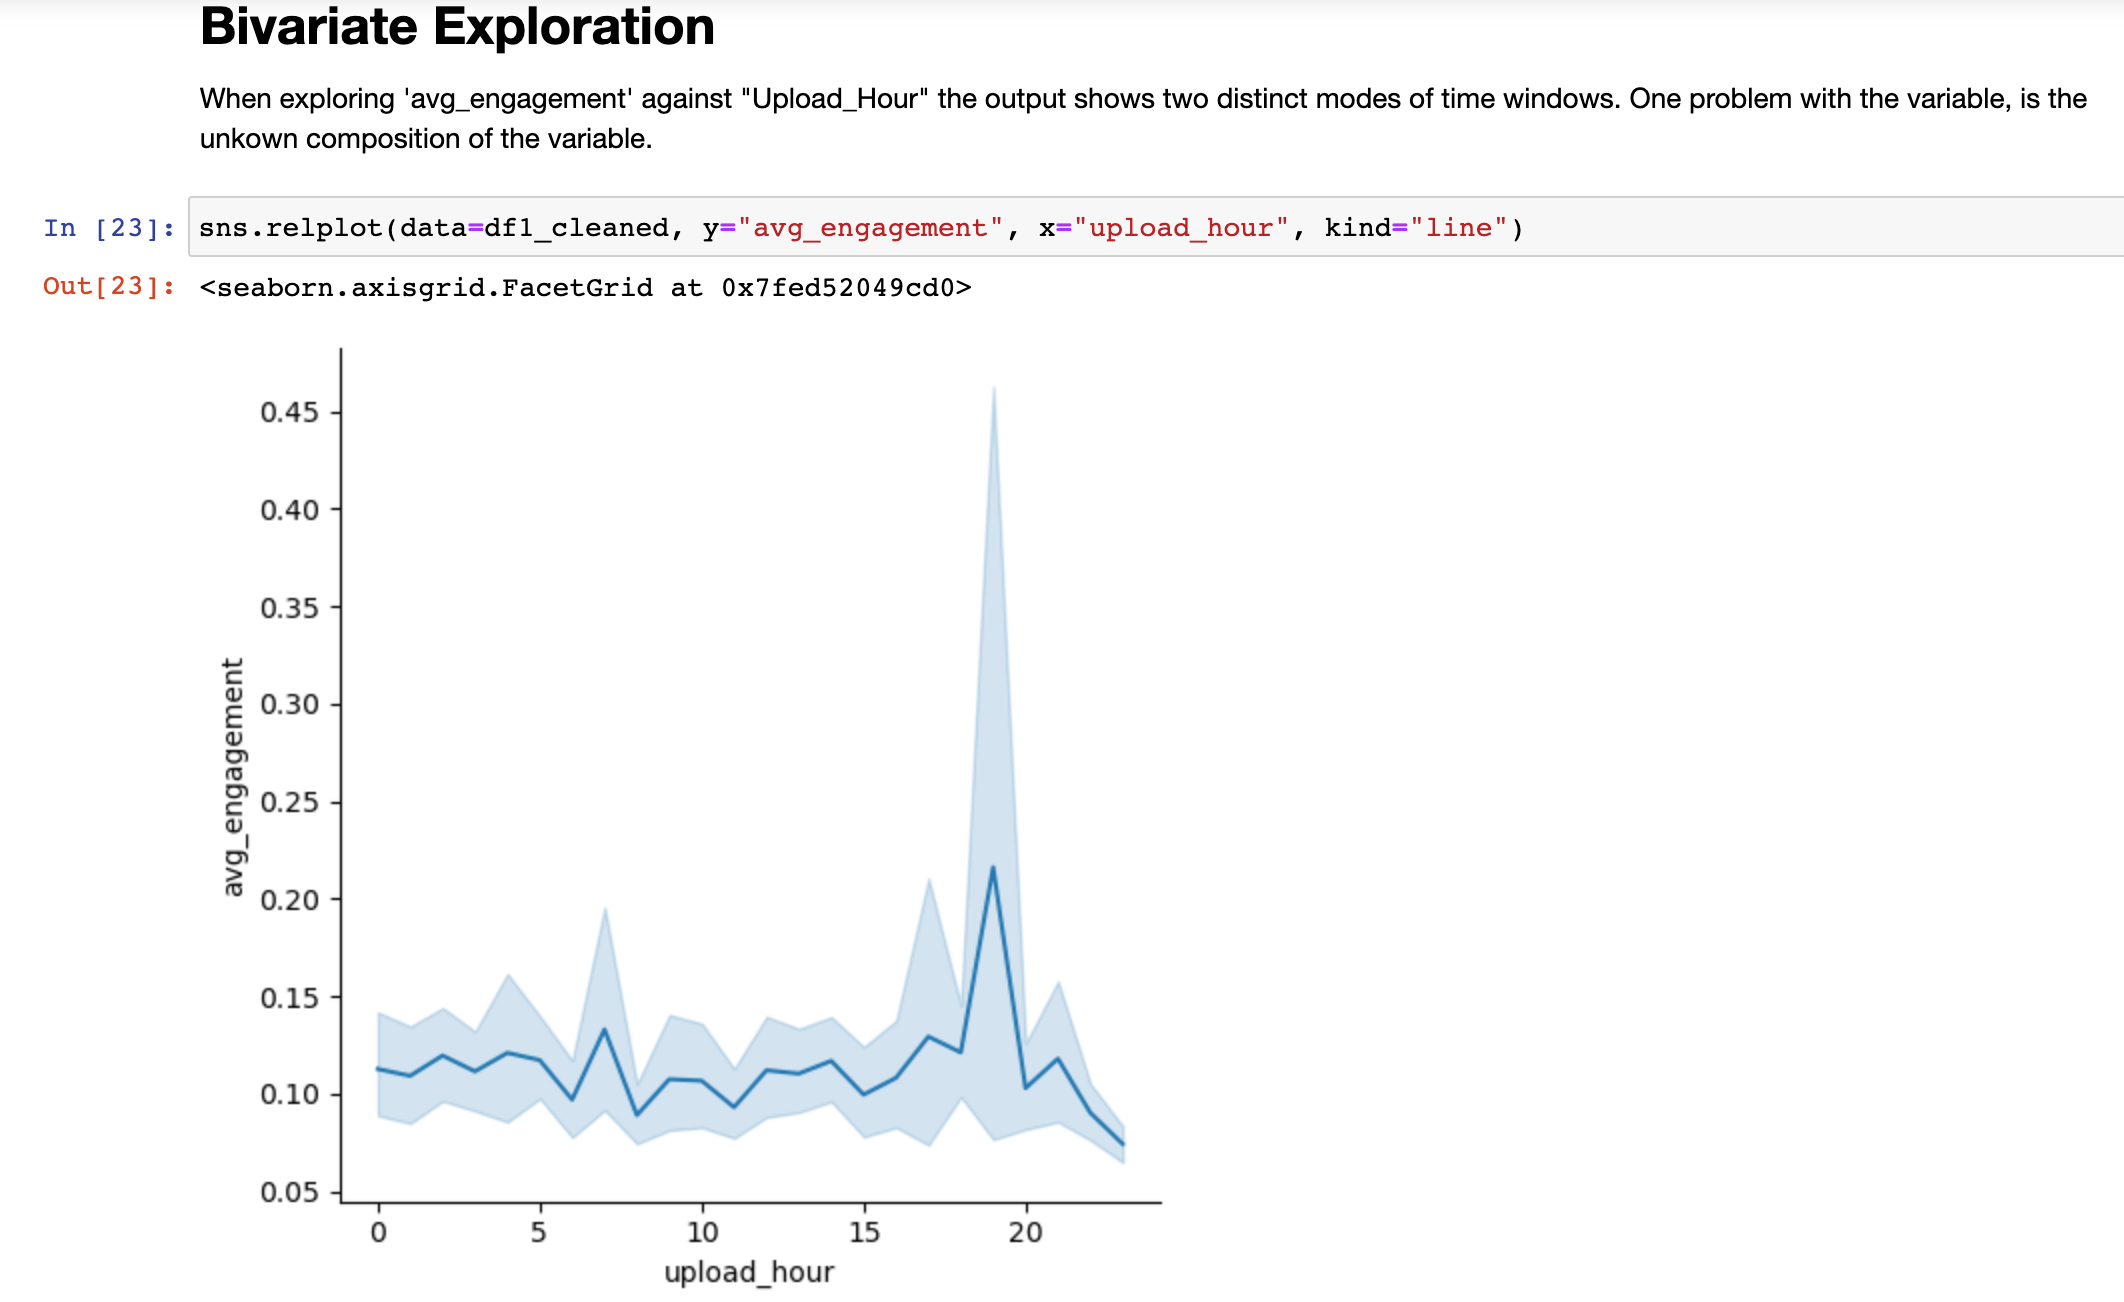
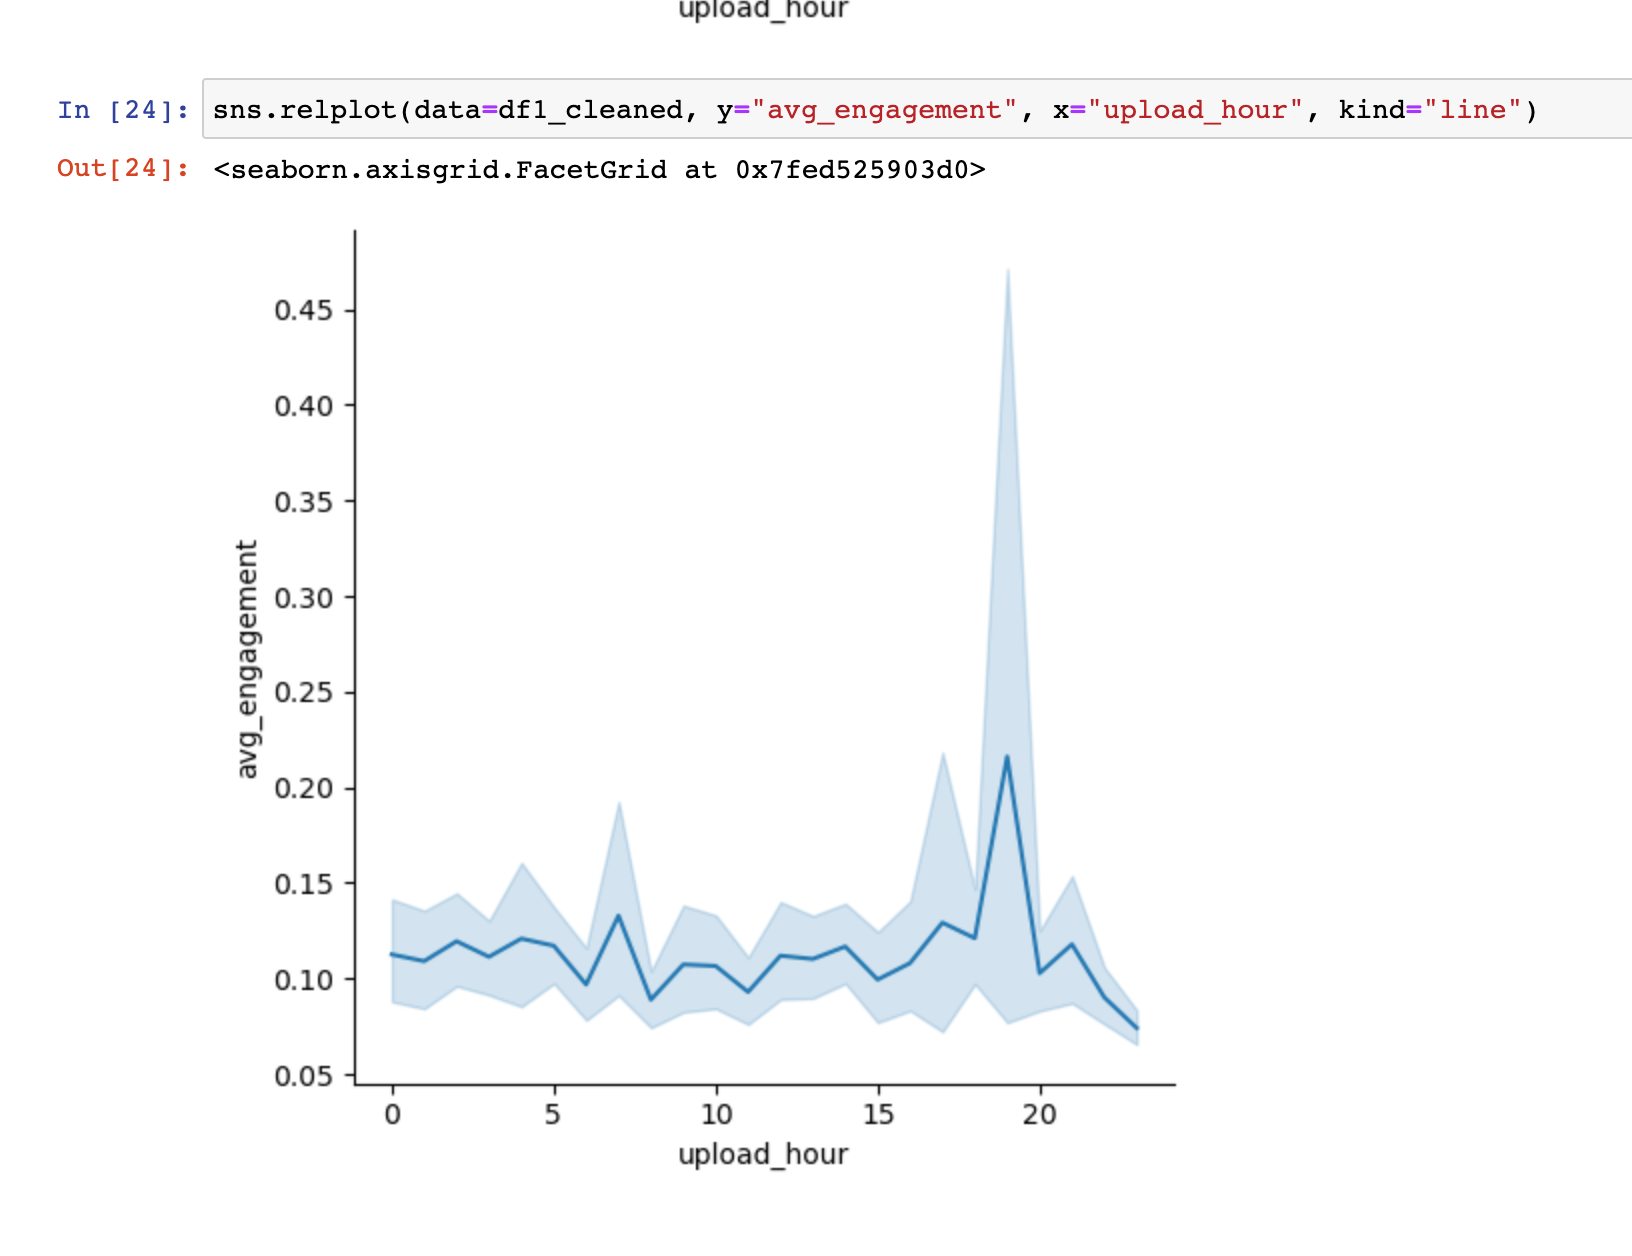
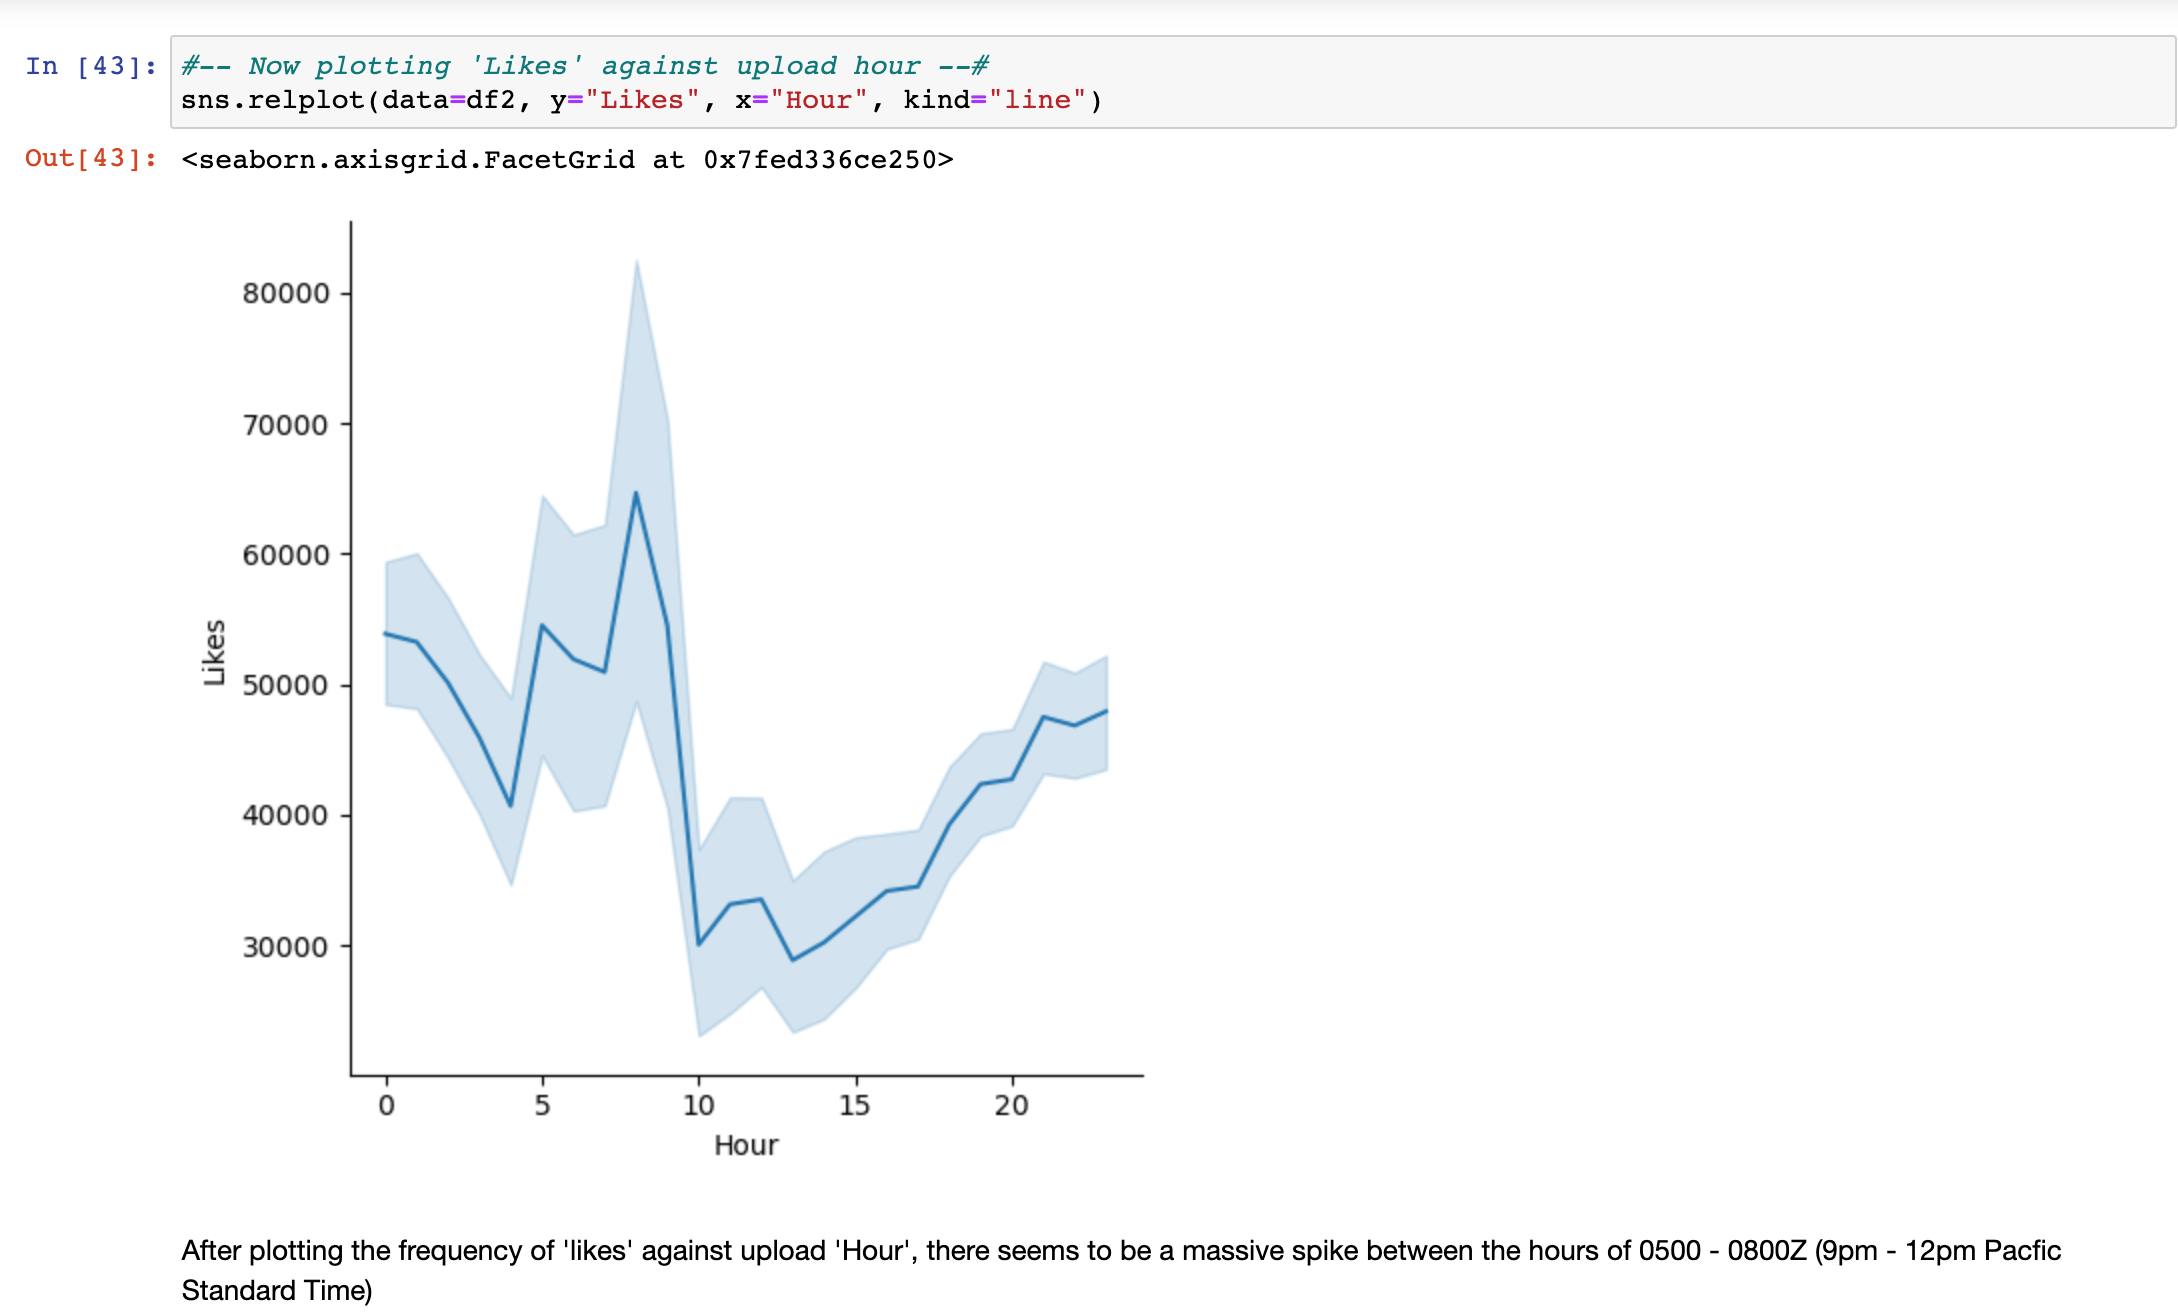
While most frequencies of content uploads happen between the 1500 to 2200 Zulu time hour, the time-window for the maximum engagement is 0500 to 0800 Zulu (9-12 PST). This was apparent in the small-dataset, when comparing average engagement against upload hour, the resulting distribution was multimodal as in two distinct peaks; 0500 to 0800z and 1500 to 2200z. The 0500-0800z peak was smaller in the smaller set, relative to the 1500-2200z, but when compared against the bigger-dataset, the bell-shaped window became more distinct. After creating the feature: Engagement Per Like, the bell-shaped curve was magnified, showcasing 0500-0800z as the highest peak of engagement when plotting EPL against upload hour. Additionally, a very minimal engagement rate was evident between the 1500-2200z window, in contrast the 0500-0800z factored 2.1 times the amount of engagement compared to the 1500-2200z window.
2. How do hashtags factor into engagement on Instagram?
According to the data, hashtags have very minimal factor in engagement; If anything one or zero hashtags is better than two or more hashtags.
3. How long will content take to reach the maximum engagement on Instagram?
According to the data, the 300-500-day window seems to double in engagement, then double again at the 700-day mark. The highest amount of engagement will occur at approximately the 700-day mark. Content engagement peaks and drops dramatically after the 600–800-day mark.
4. What ‘day of the week’ is best to upload to Instagram?
The data seems to suggest that there is no particular ‘day of the week’ that engagement increases on Instagram.
5. What ‘day(s) of the month’ are best to upload to Instagram?
The data suggests that a from the days ( 20th – 31st ) of every month, are the days with the highest spikes of commenting engagement.
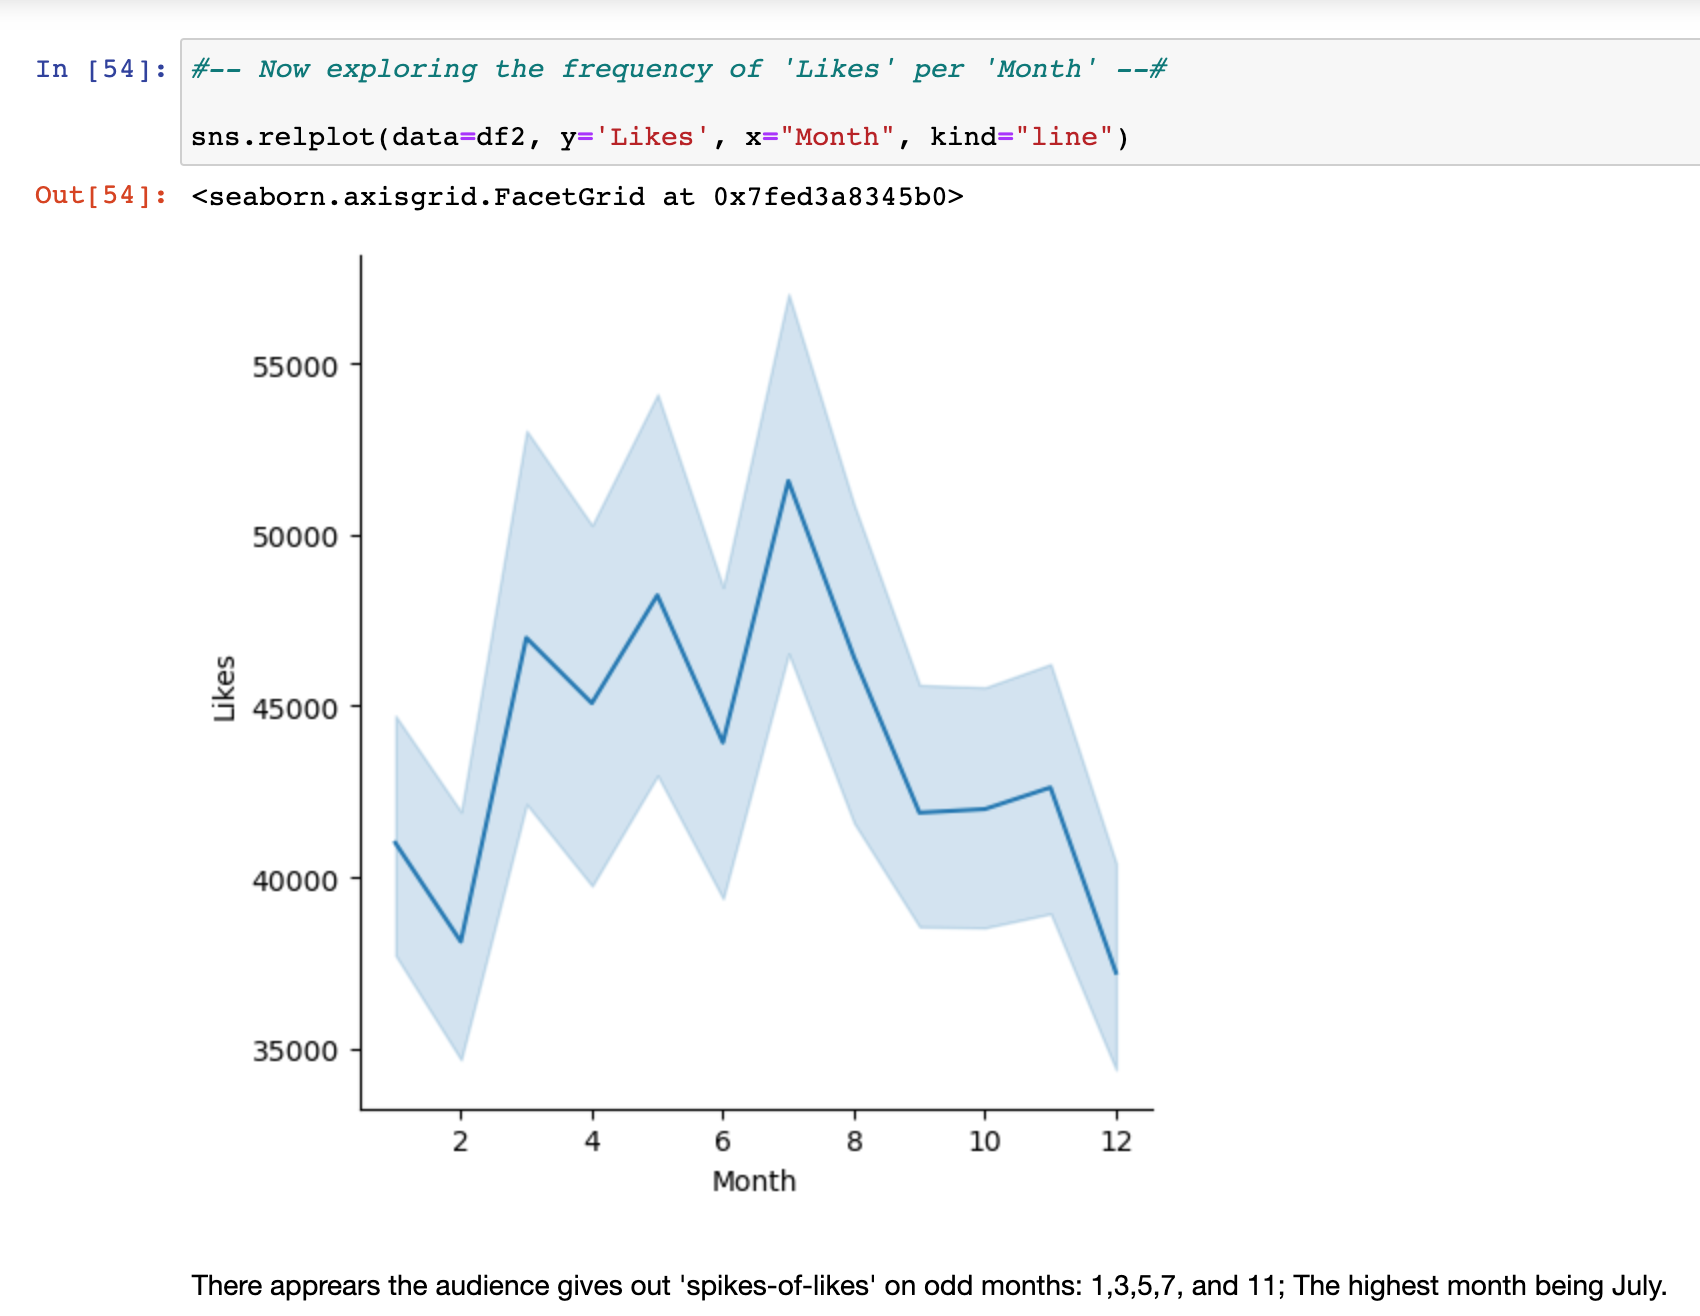
6. What Month(s) is best to Upload to Instagram?
It appears the audience gives out 'spikes-of-likes' on odd months: 1,3,5,7, and 11; The highest month being July.
In closing, after observation of the data, the null-hypothesis is rejected in favor of the alternative-hypothesis: the distribution of user-engagement is not random. First, all available engagement metrics indicate that 0500-0800 Zulu time is the prime-time for audience engagement. Second, the use of hashtags was detrimental to content engagement with a graph indicating an asymptotic decrease after the use of more than one hashtag per piece of content. Third, content visibility appears to be a maturation process with a maximum life around 800 days. Lastly, there appears to be no particular day of the week that to upload at the same time, the ‘day(s) of the month’ are any between the 21st and 30th. Oddly, the best months to upload to Instagram are the Odd months of 1,3,5,7,9.
Work Cited
Arvidsson, J. (2023, August 30). Instagram coders. Kaggle. https://www.kaggle.com/datasets/joebeachcapital/instagram-coders
GATR Journal of Management and Marketing Review - Researchgate. (n.d.). https://www.researchgate.net/journal/GATR-Journal-of-Management-and-Marketing-Review-2636-9168
Mpletsos, V. (2021, March 1). 1100 Instagram users Datetime posts data. Kaggle. https://www.kaggle.com/datasets/vasileiosmpletsos/1100-instagram-users-datetime-posts-data
Pandey, Y. (n.d.). SAS vs python. LinkedIn. https://www.linkedin.com/pulse/sas-vs-python-yuvaraj-pandey/
Grubich, M. (2023, June 27). Taking your YouTube game to the next level with Kruskal-Wallis: An insider’s guide to leveraging data insights. Bloomingbiz.marketing. https://www.bloomingbiz.marketing/blog/taking-your-youtube-game-to-the-next-level-with-kruskal-wallis-an-insiders-guide-to-leveraging-data-insights
Team, I. C. (2021, March 23). Python vs. R: What’s the difference? IBM Blog. https://www.ibm.com/cloud/blog/python-vs-r
Related articles:
What is the Best Time to Upload to YouTube?
What Category is Best for YouTube?