

How Much Can You Contribute to a Political Campaign?

Abstract:
Bottom Line Up Front: Washington Education Political Action Committee is the largest financial contributor to state initiatives and candidates.
This study explores the distribution of political donations in Washington State using a dataset from www.Data.gov. The null hypothesis posits that the distribution is random, while the alternative hypothesis suggests otherwise. Four predictive models, including Neural Net, Gradient Booster, Polynomial Regression, and LOESS, are employed to forecast donation patterns. The dataset is cleaned, and statistical tools such as KDE plots and Shapiro-Wilk tests are used for analysis. However, none of the models provide accurate predictions, leading to acceptance of the null hypothesis. The study also identifies top donors and observes trends in donation frequency. While predictive accuracy is lacking, the exploratory analysis provides valuable insights for political campaign strategy. The study answers the following research questions:
Research Questions:
1. How many unique political donors?
2. Who are the top 30 names of the most frequent donors?
3. Which donors have contributed the largest sums of money throughout the years?
4. Who is the top donor of all time?
5. Given the 4 models, Neural Net, GradientBooster, Polynomial Regression, and LOESS, can a accurate predictive model be constructed from the data?
Get the Code on Github: Political Donations

Null Hypothesis H0:
The distribution of political donations is random.
Alternative Hypothesis H1:
The distribution of political donations is not random.

Context:
The contribution of this study to the field of Data Analytics and voter awareness is to create a predictive model to predict political donations in future years. With this information a political campaign can forecast investment put into a political cause. Moreover, an article titled, The Effects of Political Donations on Election Outcomes, showcases a study using Polynomial Regression testing to explore engagement strength using the identical variables of ‘filer_name’, ‘amount’, and ‘years’ (Sagepub, 2022). They found that these variables are key factors in overall election outcome and voter comprehension. The Polynomial Regression, model’s variables in the cartesian space in order to create a line of best fit (Yale, 2019). It helps explain one variable’s relationship to another (Wikipedia, 2020). Understanding these variables can help describe the relationship between the Independent Variables and Dependent Variables.
In a study called, Predicting Donations using Machine Learning, found that using a Neural Network was helpful in predicting donation amounts (Acadia University, 2021). Another study from Dataquest.io, used a GradientBoost Ensemble to help build a predictive model using both the indicated variables (2018). A statistical analysis from researchgate.net found that the LOESS model was useful in identifying voter behavior using the germane variables. LOESS is typically used for: Fitting a line to a scatter plot or time plot where noisy data values, sparse data points or weak interrelationships interfere with your ability to see a line of best fit (statshowto.org, 2019). Locally estimated scatterplot smoothing, or LOESS, is a nonparametric method for smoothing a series of data in which no assumptions are made about the underlying structure of the data (noaa.gov, 2018).

Data
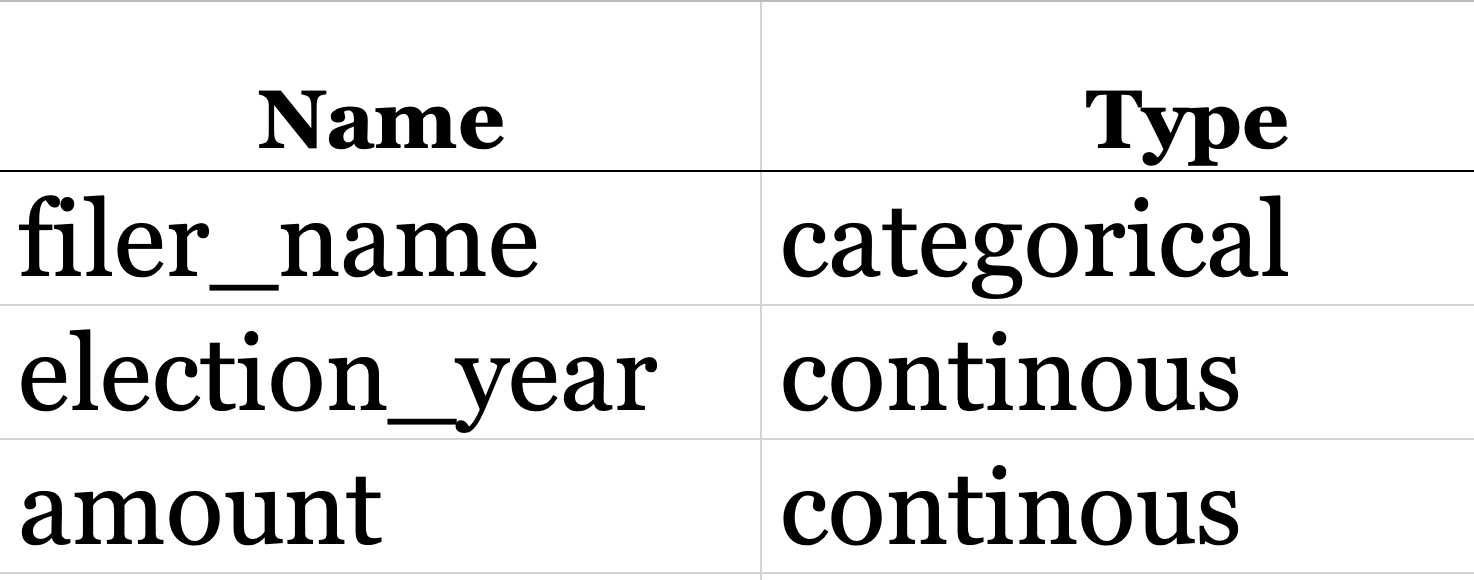
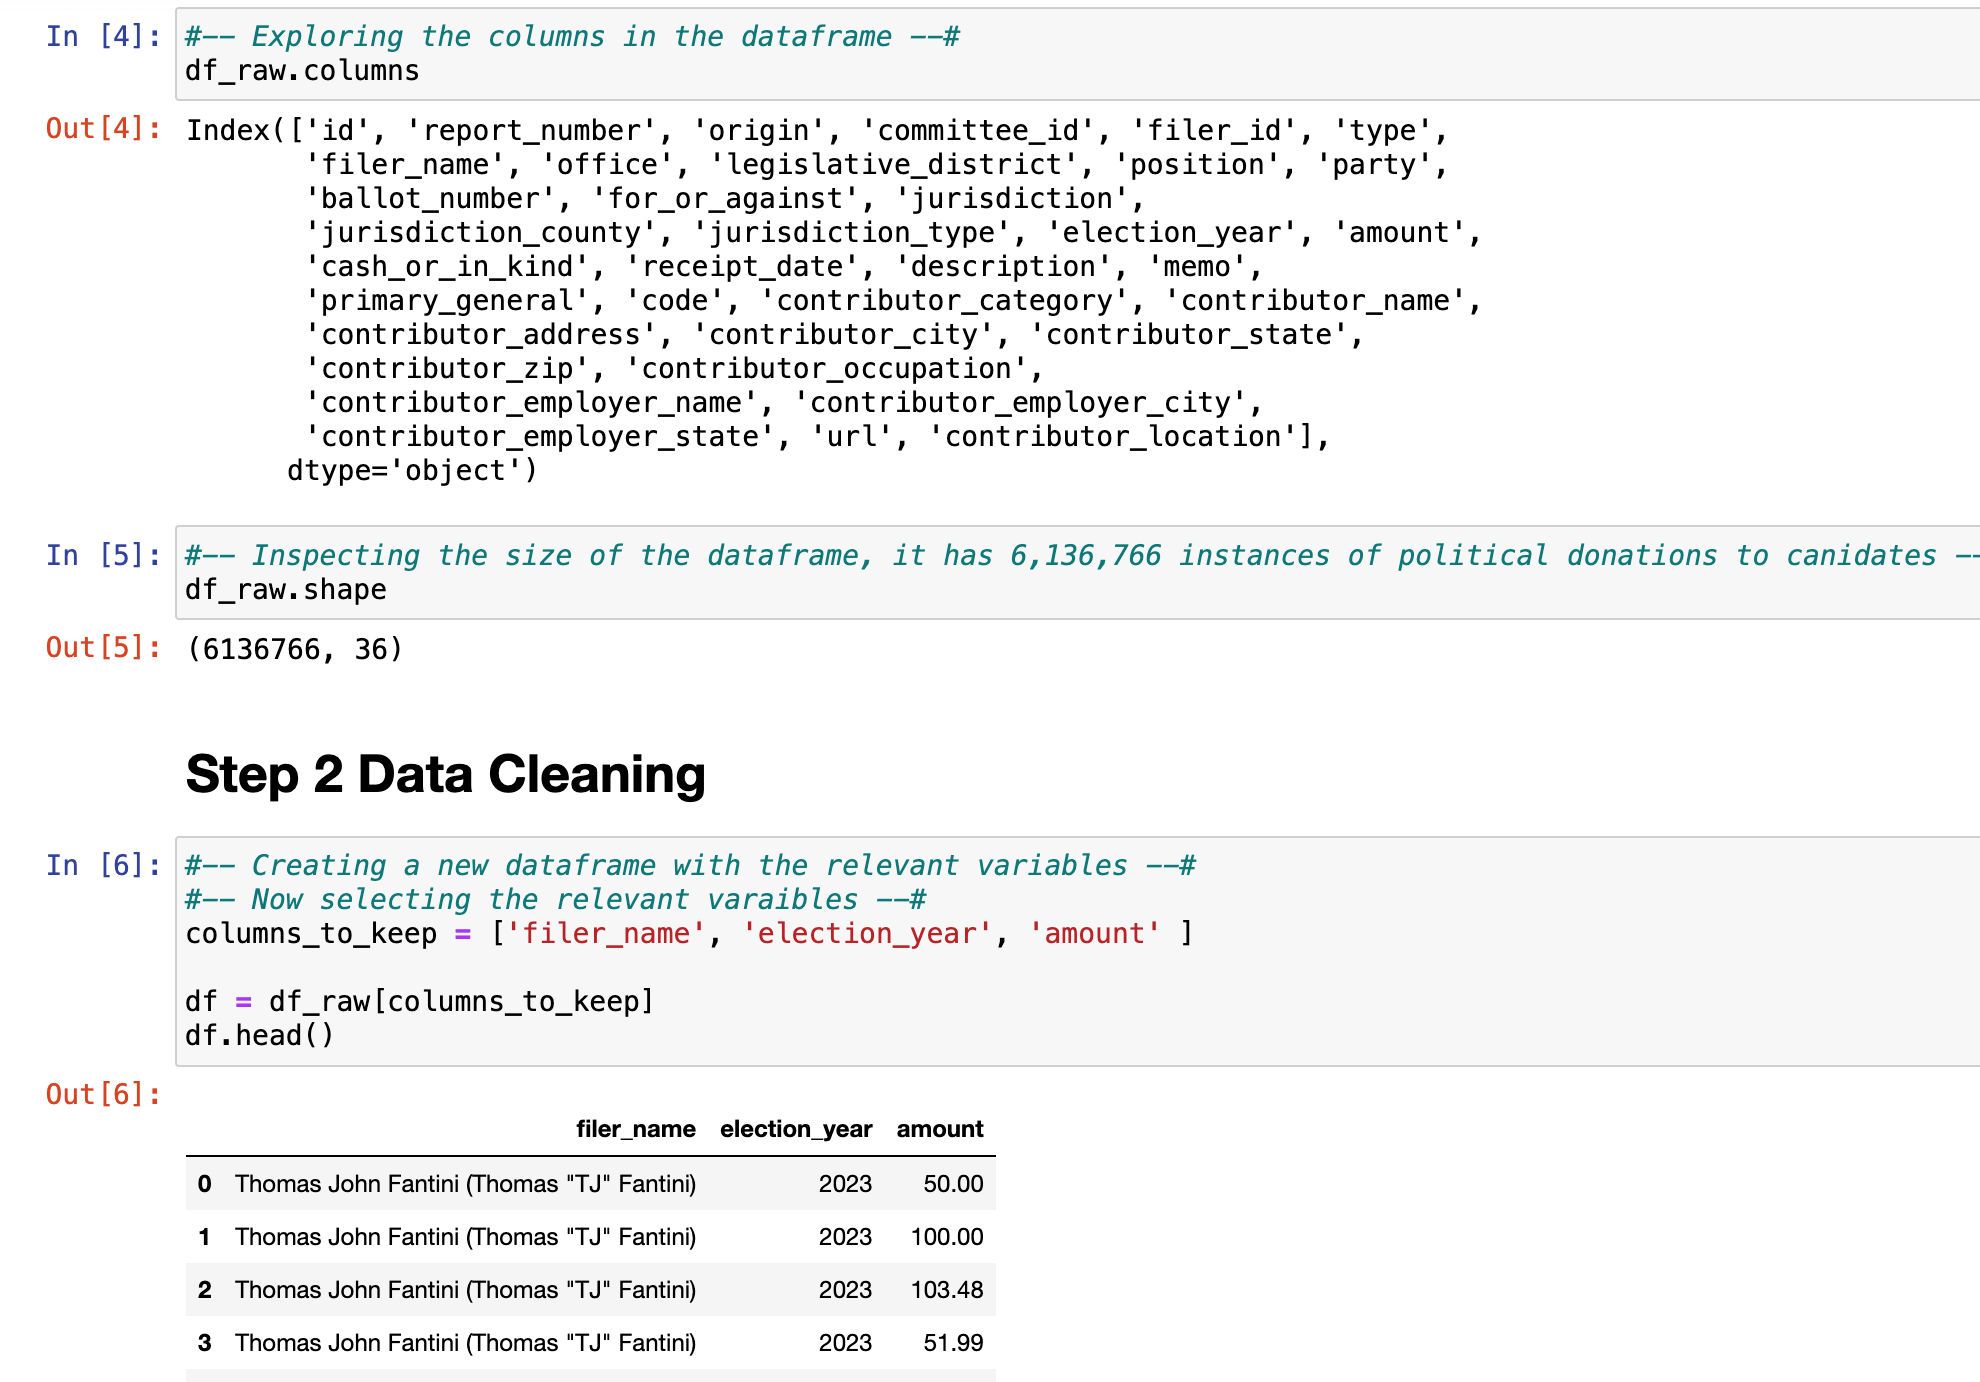
An open-source dataset of campaign contributions data containing the necessary variables about donations in Washington State can be sourced from www.Data.gov. Data.gov is the opensource repository / organization that hosts the datasets. The dataset contains almost 6,136,766 rows (before any rows where removed) and 35 columns. The dataset is limited to only 19 years of Washington State Campaign contributions; Spanning the years of 2007 – 2026. The dataset has multiple columns for possible exploration. Due to extreme sparsity in the majority of variables, delimitations for only 3 columns of the dataset will be used as they factor into data relevance and cleanliness: The ‘filer_name’, ‘amount’, and ‘election_year’. However, only two variables: ‘amount’ and ‘election_year’ will factor into the model’s predictions.
Link to the dataset: https://catalog.data.gov/dataset/contributions-to-candidates-and-political-committees

Data Gathering:
Plan and direct data gathering to opensource repositories (Google). Looking for keywords such as “Washington State”, “Political”, “donations”, “+ .csv”. Next, selecting the 1st to 3rd ranked piece of content (reachable csv file). Inspecting each .csv file for quality such as “length” (at least 7k rows), data cleanliness, massive gaps in data, and enough relevant variables to create an ‘X’ and ‘Y’ axis. Available to the public via Data.gov means that it may be limiting in accuracy and completeness. The 4 models were chosen because the data is non-parametric and don’t not rely on data assumptions. According to ScienceDirect, NOAA.gov, statshowto, and kdnuggets, the four stated models:
Do Not Assume Linearity: The relationship between X and the mean of Y is linear.
Do Not Assume Homoscedasticity: The variance of residual is the same for any value of X.
Do Not Assume Independence: Observations are independent of each other.
Do Not Assume Normality: For any fixed value of X, Y is normally distributed.
Data Analytics Tools and Techniques: A KDE plot was used to visualize the distribution and Shapiro-Wilk was used to test for normality. The stated models are germane to studying this data because they can predict based off a relationship between variables. Additionally, the stated models do not assume normality in the data (Boston, 2019); Overall, this is an exploratory quantitative data analytic technique and a predictive statistic. The tools used will be Jupyter Notebook operating in Python code, running sklearn and Scipy api as a reliable open-source statistical libraries. Due to the data size, a Pandas data frame will be called, same with Numpy and Seaborn will be used for visualizations. A Neural Net, Ensemble method-GradientBoost, Polynomial Regression, and LOESS test will be the statistical test used with sklearn’s Linear Regression method. A presentation layer involving Univariate and by Bivariate graphs will be visualized as well.

Justification of Tools/Techniques:
Python will be used for this analysis because of Numpy and Pandas packages that can manipulate large datasets (IBM, 2021). The tools and techniques are common industry practice and have consensus of trust. TensorFlow from keras will be used to for the Neural Net.
The technique is justified through the integer variables necessary to plot against a timeline. In so doing, may just reveal different modes of frequency distribution. Another reason why the stated tests are ideal, is because these tests span a range of statistical options that encompass a more comprehensive analysis of the variables. Because of the size of the dataset, pandas and Numpy will be called. Python is being selected over SAS because the Python has better visualizations (Panday, 2022).
Project Outcomes: In order to find statistically significant differences, the proposed end state is a non-parametric predictive statistical model is that is used to forecast the value of a variable based on the value of another variable. (IBM, 2019). A visualization of the frequency distribution of the ‘amount’ against a ‘election_year’ timeline, indexed at 2007. A cleaned dataset of all the correctly labeled columns and rows, for replication. A better understanding of previously stated groups with exploratory graphs, giving support as to what trends maybe noticeable. Lastly, a copy of the Jupyter NoteBook with the Python code will be available, along with a video presentation. According to the same study Polynomial Linear Regression was instrumental in support for alternative hypothesis, against other categorical variables. (Sagepub, 2022).


While the dataset indicated that some people did get donations refunded to them, the negative numbers wouldn’t be enough to skewed the distribution to be on the 'negative' side of '0'. Therefore, it is the outliers that skewed small amounts to viewed as negative on the curve; Ergo, the variable 'amount', must be converted to the absolute value.


#-- Barplot of the indicating the amount of money donated per year --#
plt.figure(figsize=(15, 10))
sns.barplot(data = df, x="election_year", y= 'amount')
plt.title('Bar Plot - total donations over the years')
plt.show()

Notice that 2010 is the highest year for donations. Notice that presidential election years have spikes of donations, with the year prior to a presidential election, yielding the least. Aside from the outlier years of 2010 and 2018, the peak-years are consistently around $400 Million.


The above graph indicates that the Washington Education Association Political Action Committee (WEP) and Washington Relators Political Action Committee (RAP) are the most frequent contributors to political initiatives or candidates; Meanwhile, Firefighters Action Support Team is in a distant 3rd place.
It appears that 2015, the biggest outlier contributor(s), began to have a competition. Notice that from 2015 on, both WEP and RAP's outlier donors, have a very similar distribution; WEP always able to keep the lead as the Washington Realtors Political Action Committee donates in an attempt to match.

The number of donations to candidates is neither increasing nor decreasing over time, as verified with the following statistical tests. The outliers where dropped and Shapiro-Wilk was called to test for normality of residual distribution.


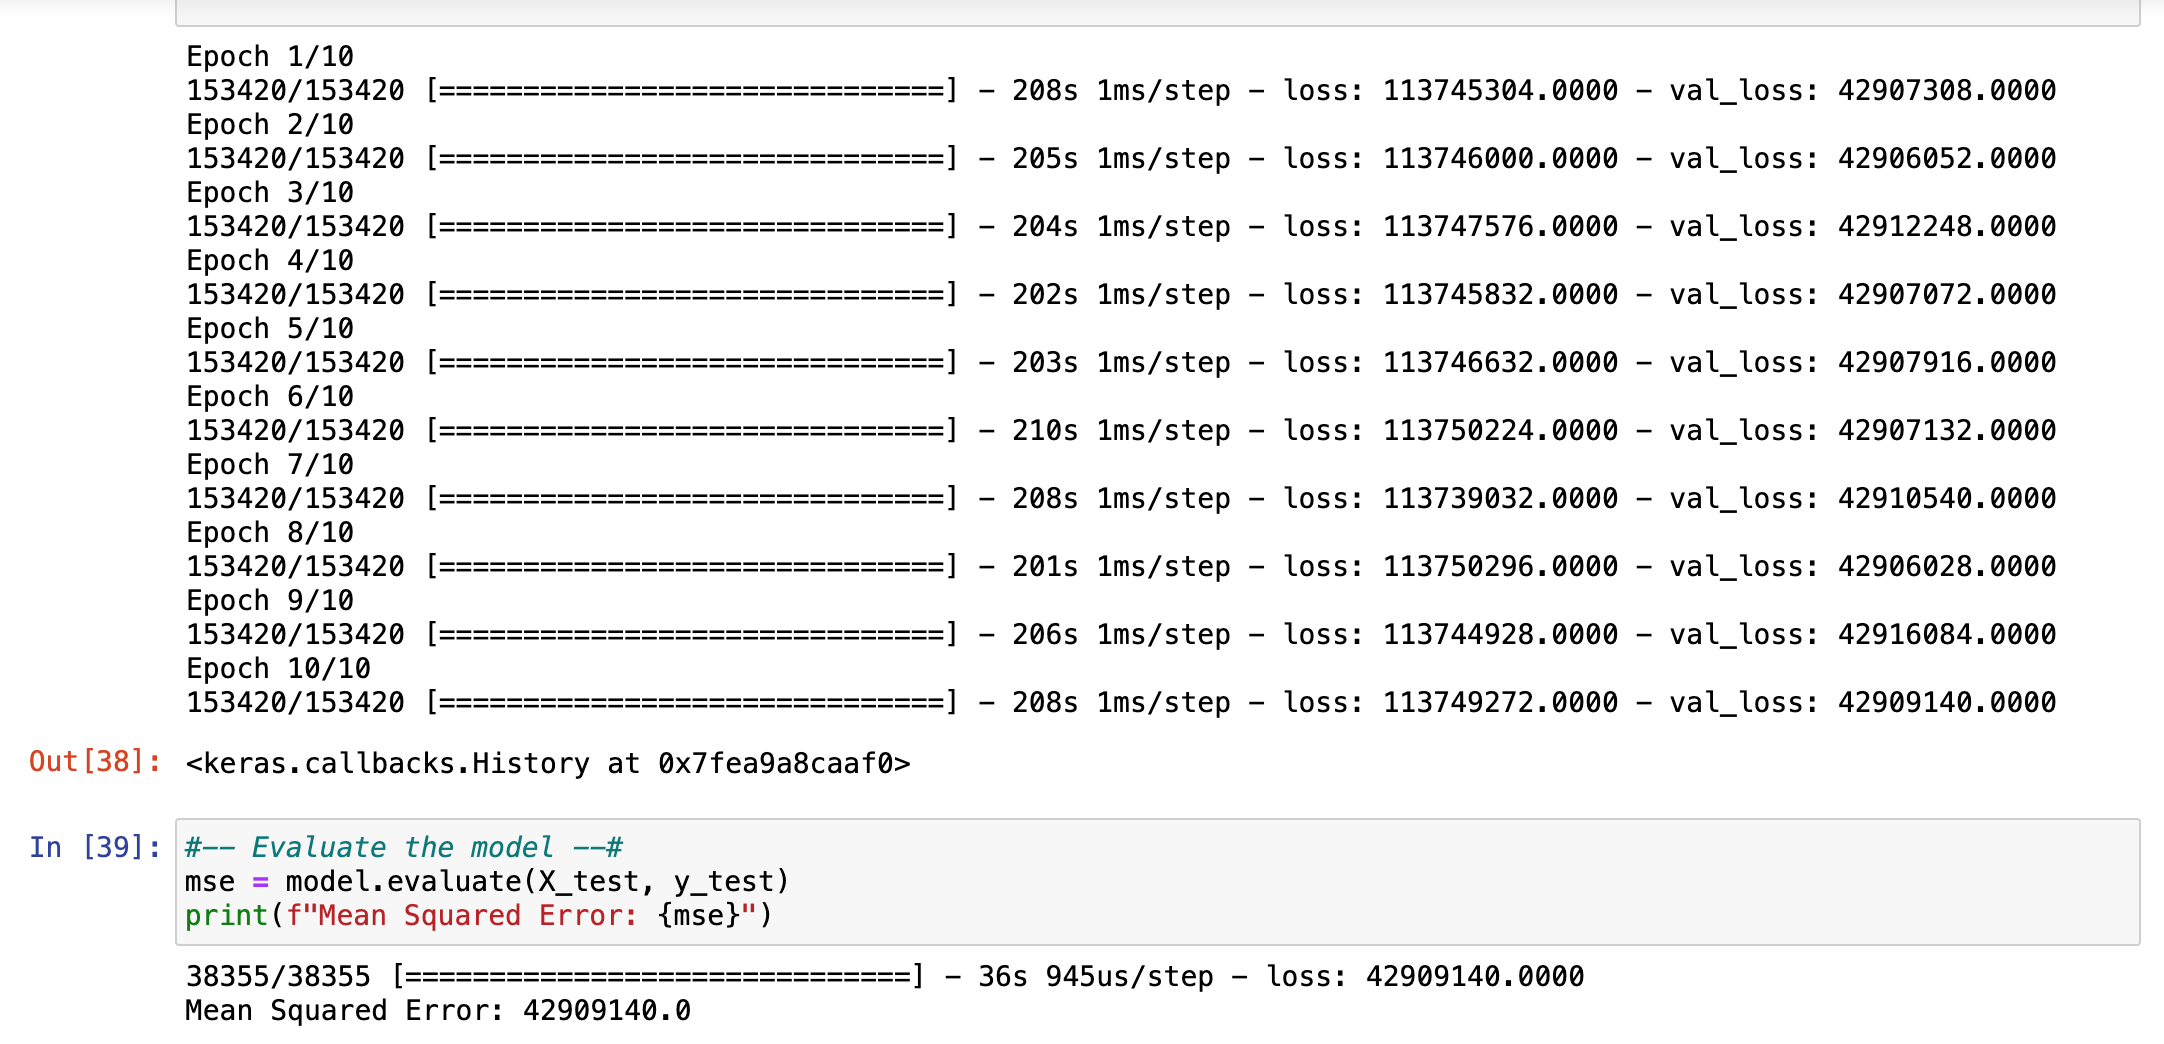

The neural net yielded a Mean Squared Error score of 42,909,140 after 10 epochs. When testing other model weights, it would be too computationally expensive to run say 100 epochs to increase the model accuracy. The running more epochs wont necessary improve the model score either. Lastly the model predictions for the next 10 years is trending around the $233 mark.

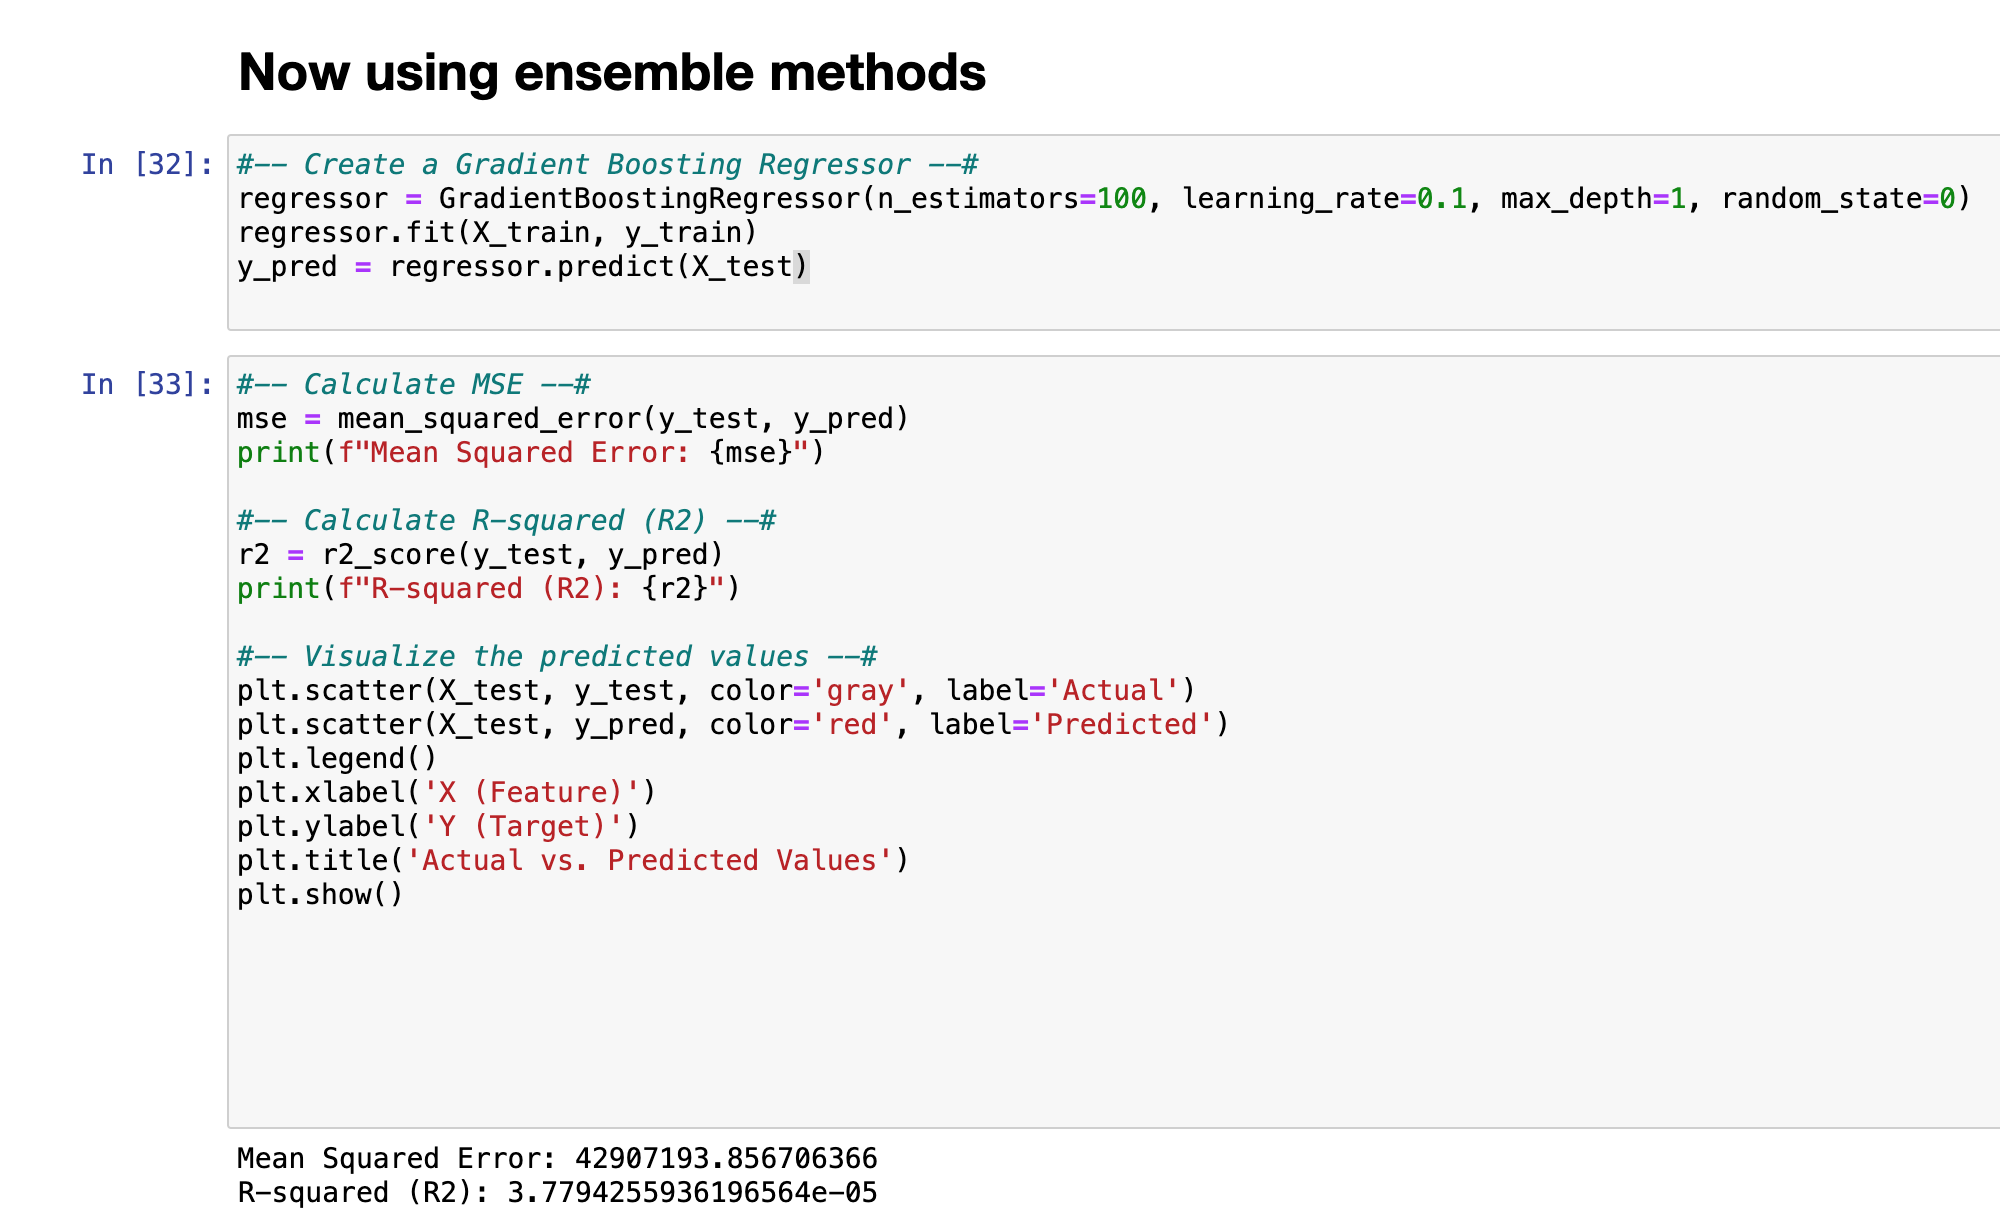
Gradientbooster is an ensemble method, meaning, it runs numerous small decision trees at the same time. It’s a strong non-parametric model that can handle dirty and non-parametric data.
The Mean Squared Error (MSE) is a metric used to measure the average squared difference between the predicted values and the actual values in a regression problem. It's calculated by taking the average of the squares of the differences between the predicted and actual values for each data point.
MSE is a crucial tool to assess the accuracy of a regression model, where a lower MSE indicates that the model is closer to the actual values. With a MSE of 42,907,193 does not indicate an accurate model and is identical to the Neural Net's MSE score. Additionally the R2 or Coefficient of determination should be as close to '1' as possible to indicate an accurate score. An R2 score of 0.0000377 is not an accurate model.

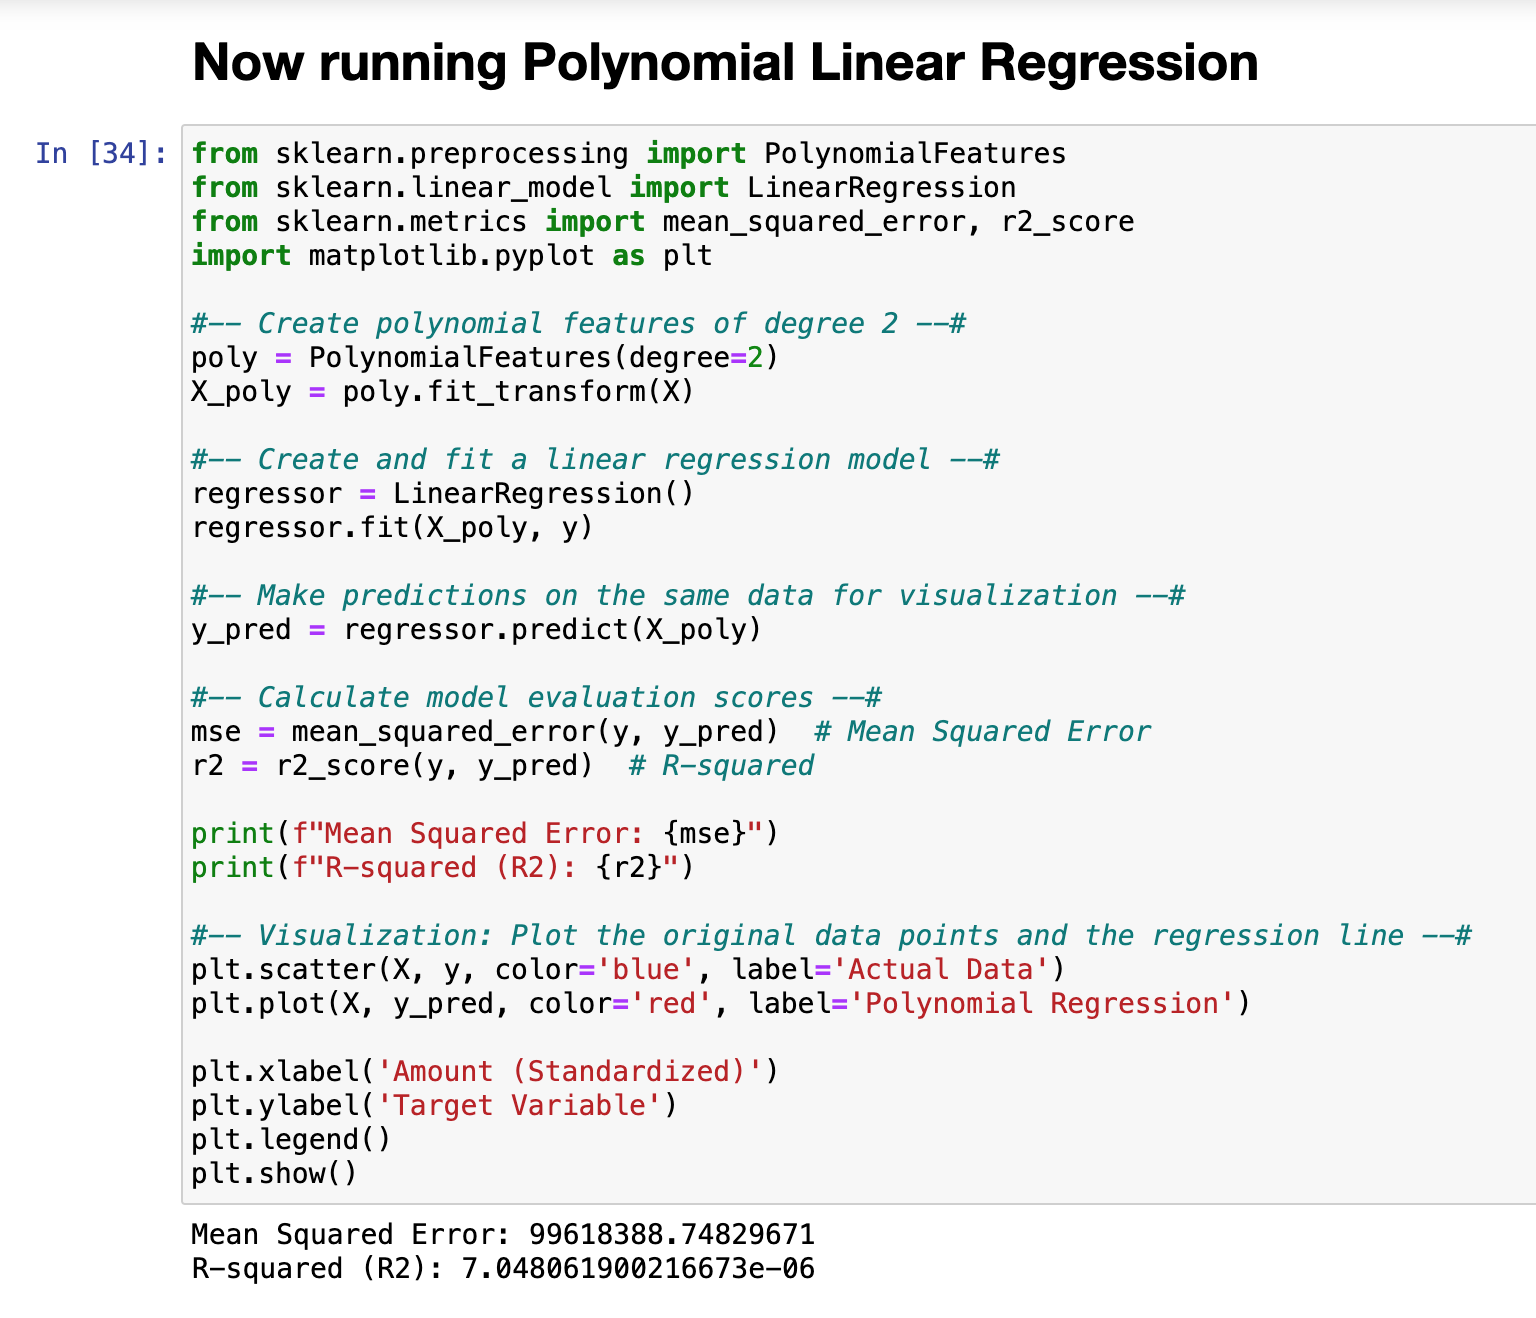

With a MSE of 99,618,388 does not indicate that the model is nowhere near accurate and identical to the Neural Net's MSE score. Moreover, an R2 score of 0.000006 is not an accurate model.
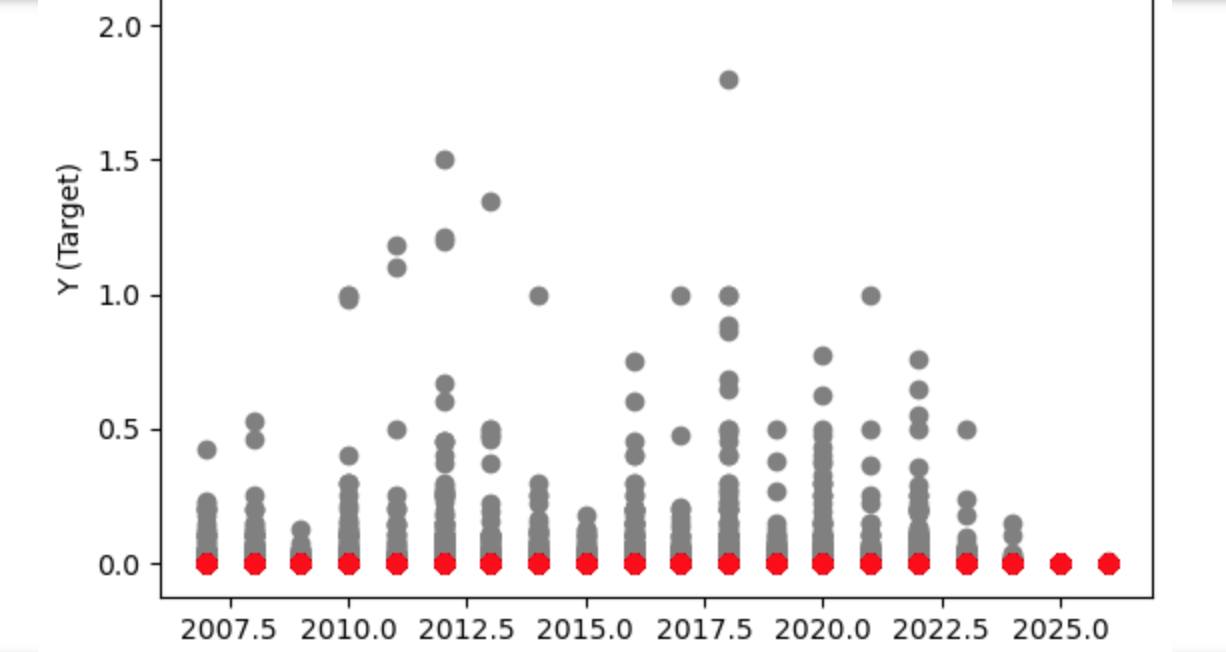
In the above timeline, 2018 is the densest year for political donations.


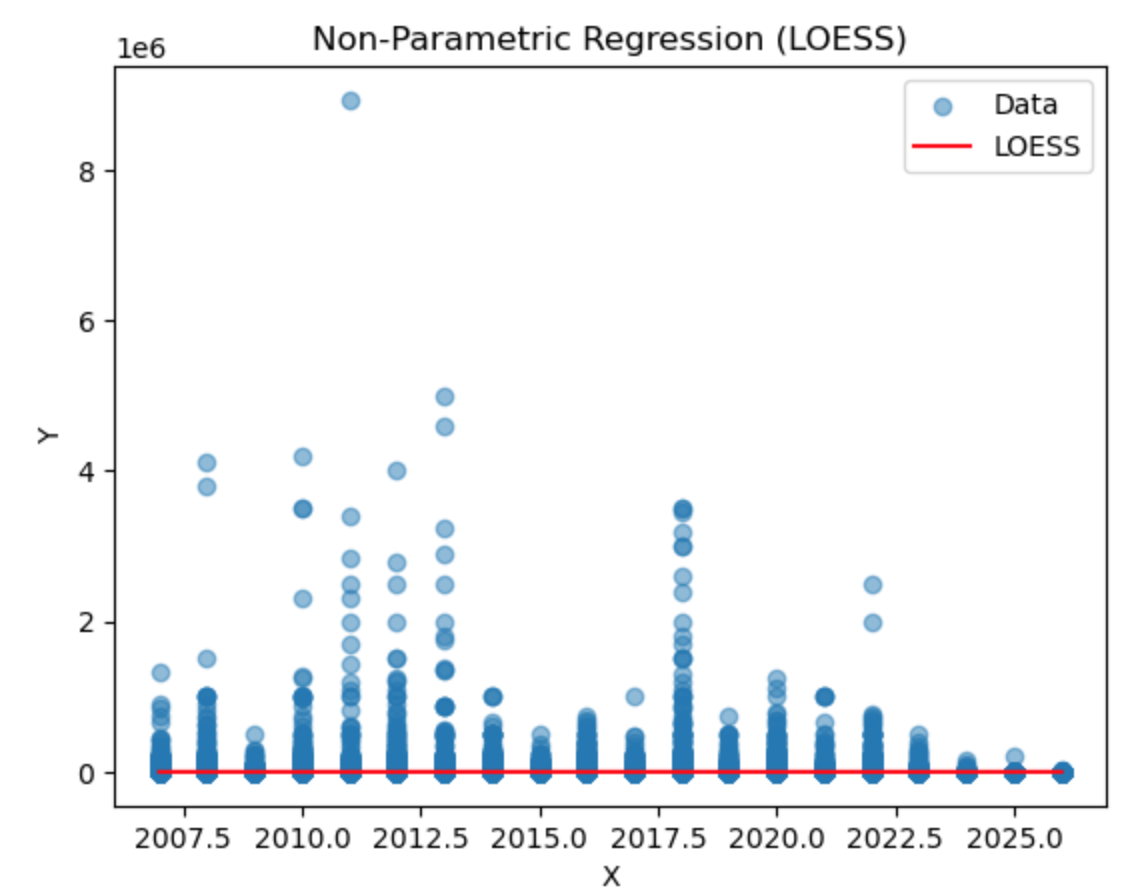
With LOESS there's no single score, like R-squared in linear regression, for LOESS smoothing because it's not a traditional regression method but rather a data visualization tool. The above visualization indicates the line of best fit, "red line", is directly on the '0' mark; Showcasing that there is no apparent trend in the data on direction or the other. While the distribution of the residuals match’s the previous visualizations.

In Final Analysis:
1. How many unique political donors?
According to the data there are 9629 unique political donors to include political action committees.
2. Who are the Top 30 names of most frequent donors?
The output was rendered in the above visualization.
3. Which donors have contributed the largest sums of money throughout the years?
The above output was rendered with the top 5 PACS: Washington Education Association Political Action Committee (WEP) and Washington Relators Political Action Committee (RAP) are the most frequent doners to political initiatives or candidates; Meanwhile, Firefighters Action Support Team is in a distant 3rd place.
4. Who is the top donor of all time?
Washington Education Association Political Action Committee (WEP)
5. Given the 4 models, Neural Net, GradientBooster, Polynomial Regression, and LOESS, can a accurate predictive model be constructed from the data?
No, we accept the null hypothesis, that the frequency distribution of political donations is random and does not demonstrate any patterns. If the alternative hypothesis were true, given the dataset size, one of the four predictive models would have yielded more accurate results.
The data was visually left skewed towards the ‘0’ mark and tested negative for being Gaussian or parametric in the Shapiro-Wilk test. The neural net had an accuracy of 42,909,140; after experimenting with different model weights. The mean squared error should be near 0, 42 million is completely unacceptable. The mean square error of the gradient booster ensemble method was similar at 42,907,000 and an Coefficient of Determination score of 0.0000377. The coefficient should be near 1, instead, it pairs with the inaccurate MSE score. Thirdly the polynomial regression, didn’t provide a good score either, with an MSE score of 99 million and a bad R2 score to match at 0.000007. Additionally, the LOESS test / visualization indications that the line of best fit, through the residuals, is at the ‘0’ mark; Reconfirming a poor predictive model. The biggest observable trend was Washington Education Association Political Action Committee (WEP) and Washington Relators Political Action Committee (RAP), correlating in donation frequency.
Lastly, though the following four models did not yield an accurate predictions, the information from the exploratory analysis could be useful for situational awareness of the political space.

Work Cited:
About linear regression. IBM. (n.d.). https://www.ibm.com/topics/linear-regression#:~:text=Linear%20regression%20analysis%20is%20used,is%20called%20the%20independent%20variable.
Artificial Neural Network. Artificial Neural Network - an overview | ScienceDirect Topics. (n.d.). https://www.sciencedirect.com/topics/veterinary-science-and-veterinary-medicine/artificial-neural-network
The effect of political donation on election outcomes ... - sage journals. (n.d.-d). https://journals.sagepub.com/doi/10.1177/21582440221084991?icid=int.sj-full-text.similar-articles.1
Flennerhag, S. (2018, January 11). Introduction to python ensembles. Dataquest. https://www.dataquest.io/blog/introduction-to-ensembles/
Loess: A nonparametric, graphical tool for depicting relationships ... (n.d.-a). https://www.researchgate.net/publication/222850262_LOESS_a_nonparametric_graphical_tool_for_depicting_relationships_between_variables
NBER Working Paper Series - National Bureau of Economic Research. (n.d.-b). https://www.nber.org/system/files/working_papers/w24413/w24413.pdf
NCEI.Monitoring.Info@noaa.gov. (n.d.). Did you know?. Did You Know? | National Centers for Environmental Information (NCEI). https://www.ncei.noaa.gov/access/monitoring/dyk/loess
Pandey, Y. (2022, May 25). SAS vs python. LinkedIn. https://www.linkedin.com/pulse/sas-vs-python-yuvaraj-pandey/
Predicting the donor journey using Machine Learning. (n.d.-c). https://scholar.acadiau.ca/islandora/object/theses:3626/datastream/PDF/file.pdf
Stephanie. (2022, January 12). Lowess smoothing in statistics: What is it?. Statistics How To. https://www.statisticshowto.com/lowess-smoothing/#:~:text=LOWESS%20is%20typically%20used%20for,a%20line%20of%20best%20fit.
Team, I. C. (2021, March 23). Python vs. R: What’s the difference? IBM Blog. https://www.ibm.com/cloud/blog/python-vs-r
What are the assumptions of XGBoost?. KDnuggets. (n.d.). https://www.kdnuggets.com/2022/08/assumptions-xgboost.html
