

The Ultimate Guide to YouTube Upload Times: When to Post for Maximum Views in 2023!
YouTube Episode: The Ultimate Guide to YouTube Upload Times: When to Post for Maximum Views in 2023!
Bottom Line Up Front:
9pm Pacific Standard Time is the ONLY time to upload videos to YouTube in 2023.
The study takes a YouTube trending videos dataset for the United States and explores it. The dataset was extracted, cleaned, and statistically tested. The analysis compares the video engagement metrics of ‘likes’, ‘dislikes’, ‘views’, and ‘comment_count’. These different groups were tested for normality via Shapiro -Wilk test.
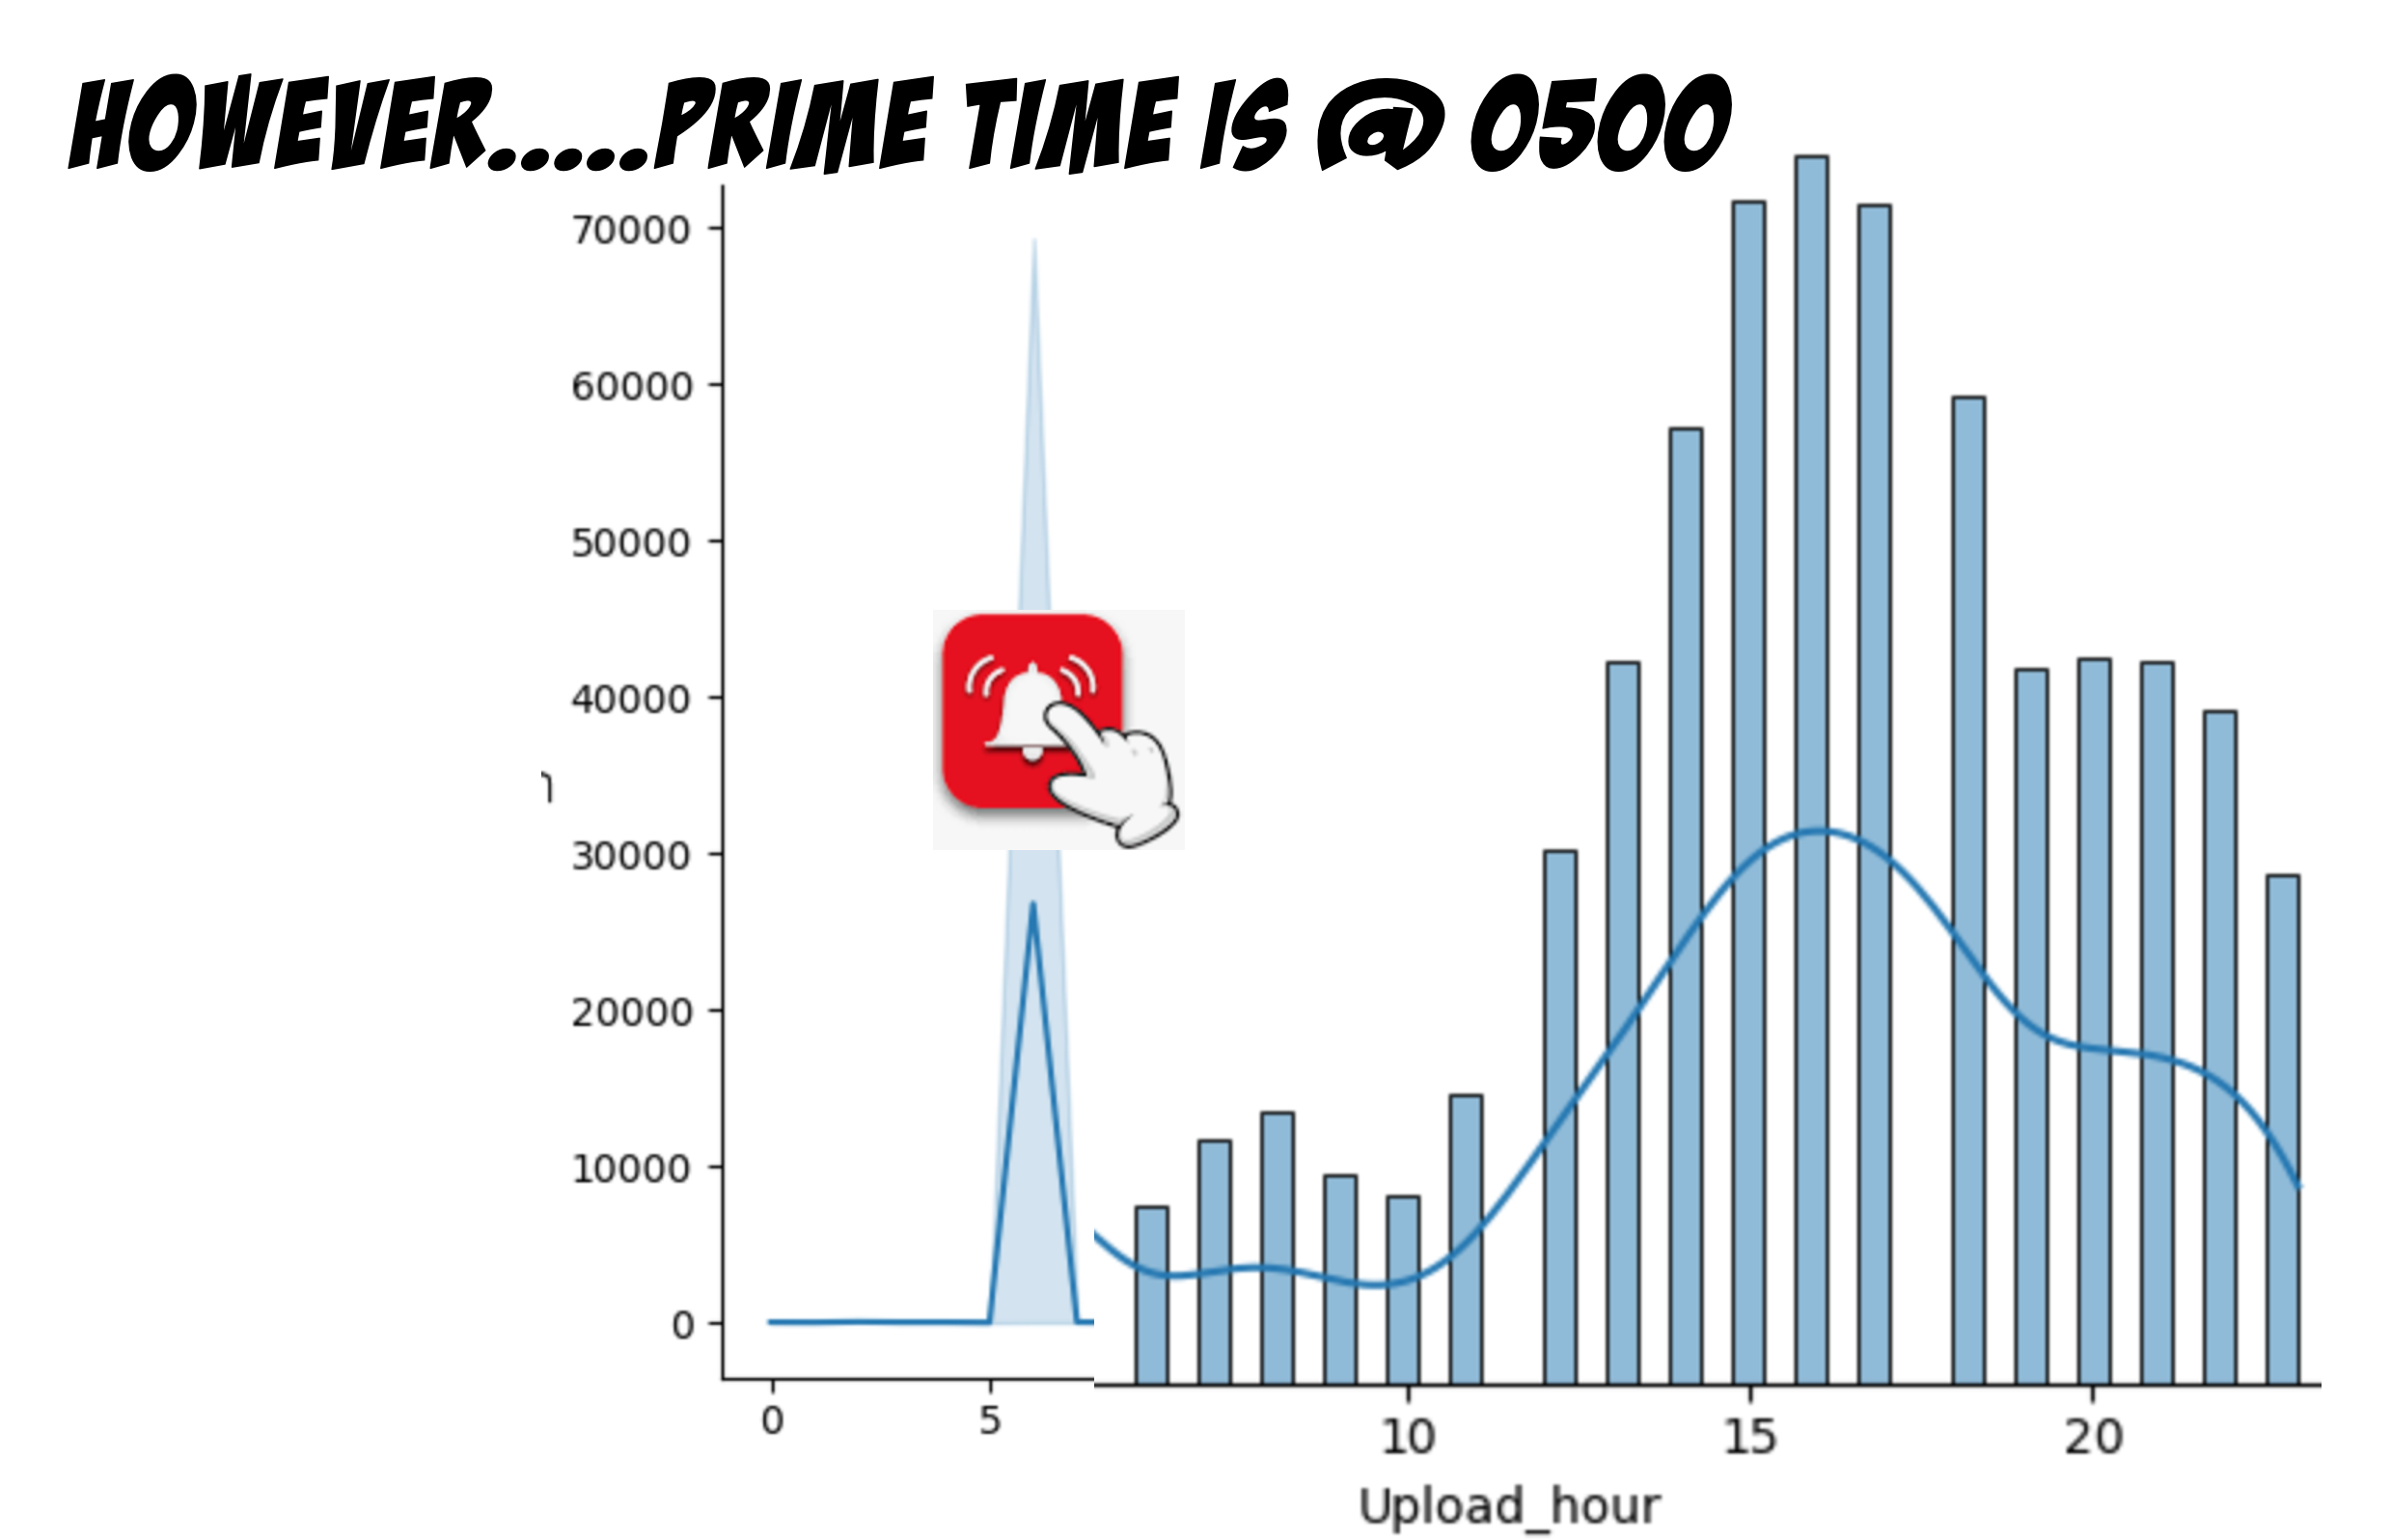
The results of the Shapiro-Wilk test confirmed that the stated variables are non-parametric. During data exploration a metric Engagement Per View EPV, was created with all four non-parametric variables. The result was a parametric variable, that tested positive for being Gaussian in the Shapiro-Wilk test. The exploration yielded interesting insights; When plotted individually, the variable’s distributions skewed one direction, then when plotted against ‘upload_hour’, all skews changed directions (except ‘dislikes). When plotted against ‘upload_hour’, EPV showcases a perfect bell-shape right along the 0500 to 0700 Zulu hour. Contrastingly, the highest frequency of video uploads is occurring during the 1600 Zulu hour.
An opensource dataset of YouTube data containing the necessary variables about video uploads. A Kaggle dataset from www.kaggle.com. Kaggle is the opensource repository / organization that hosts the datasets. The dataset contains almost 40,950 rows (before any rows where removed) and 16 columns. The dataset is limited to only 7 months of YouTube’s trending videos; Uploaded from 2017 – 2018. The dataset has multiple columns for possible exploration. Different audiences watch shows at different time-zones all over the planet. Delimitations for this analysis, only 5 columns of the dataset will be used as they factor into ROE: The ‘published_time’, ‘views’, ‘likes’, ‘dislikes’, and ‘comment_count’; The dataset is easy to work with because the columns with whole intereger values. The ‘published_time’ is in 24hour timestamp indexed on Zulu time (located in England). The time will need to be separated from the date. If you need help parsing date-times then watch this video first (Separate Date - Time in Excel). Limitations where the data size + what it contains, delimitations where of 100 IV only 5 where considered.
If you get the Dataset from Kaggle, I highly suggest you watch this quick video: How to Separate Dates in Excel in 2023.
Link you full YouTube Episode: The Ultimate Guide to YouTube Upload Times: When to Post for Maximum Views in 2023!
Exploring YouTube Videos Engagement metrics with Upload Time.
import pandas as pd
import numpy as np
import seaborn as sns
import matplotlib.pyplot as plt
from scipy import stats
%matplotlib inline
Importing the Datasets
#-- Now importing the Datasets from the following countries: USA, Great Britian, Denmark, India, and France. -- #
df_US = pd.read_csv('/Users/michaelsegaline/Desktop/WGU/New Program/D214 Capstone/USvideos_raw.csv')
df_GB = pd.read_csv('/Users/michaelsegaline/Desktop/YouTube Datasets/GBvideos.csv')
df_DE = pd.read_csv('/Users/michaelsegaline/Desktop/YouTube Datasets/DEvideos.csv')
df_IN = pd.read_csv('/Users/michaelsegaline/Desktop/YouTube Datasets/INvideos.csv')
df_FR = pd.read_csv('/Users/michaelsegaline/Desktop/YouTube Datasets/FRvideos.csv')
Exploring and Cleaning the dataset
df_US.head()
#-- Now inspecting the data types --#
df_US.dtypes
#-- Checking shape before dropping any null values --#
df_US.shape
#-- Dropping any null values --#
df_US = df_US.dropna()
df_GB.dropna()
df_DE.dropna()
df_IN.dropna()
df_FR.dropna()
#-- Exploring Descriptive Statistics --#
#-- The average number of 'views' per trending video is 2,370,839. --#
#-- The average number of 'likes' per trending video is 74,616 --#
#-- The average number of 'dislikes' per treding video is 3,508 --#
#-- The average 'comment_count' per video is 34,316 --#
df_US.describe()

Univariate Exploration
#-- Exploring Descriptive Statistics --#
#-- All time scales are indexed on 'Zulu' time (located in Greenwinch, England) --#
sns.histplot( x = df_US['Upload_hour'], kde = True)


‘Dislikes’ was the clue!
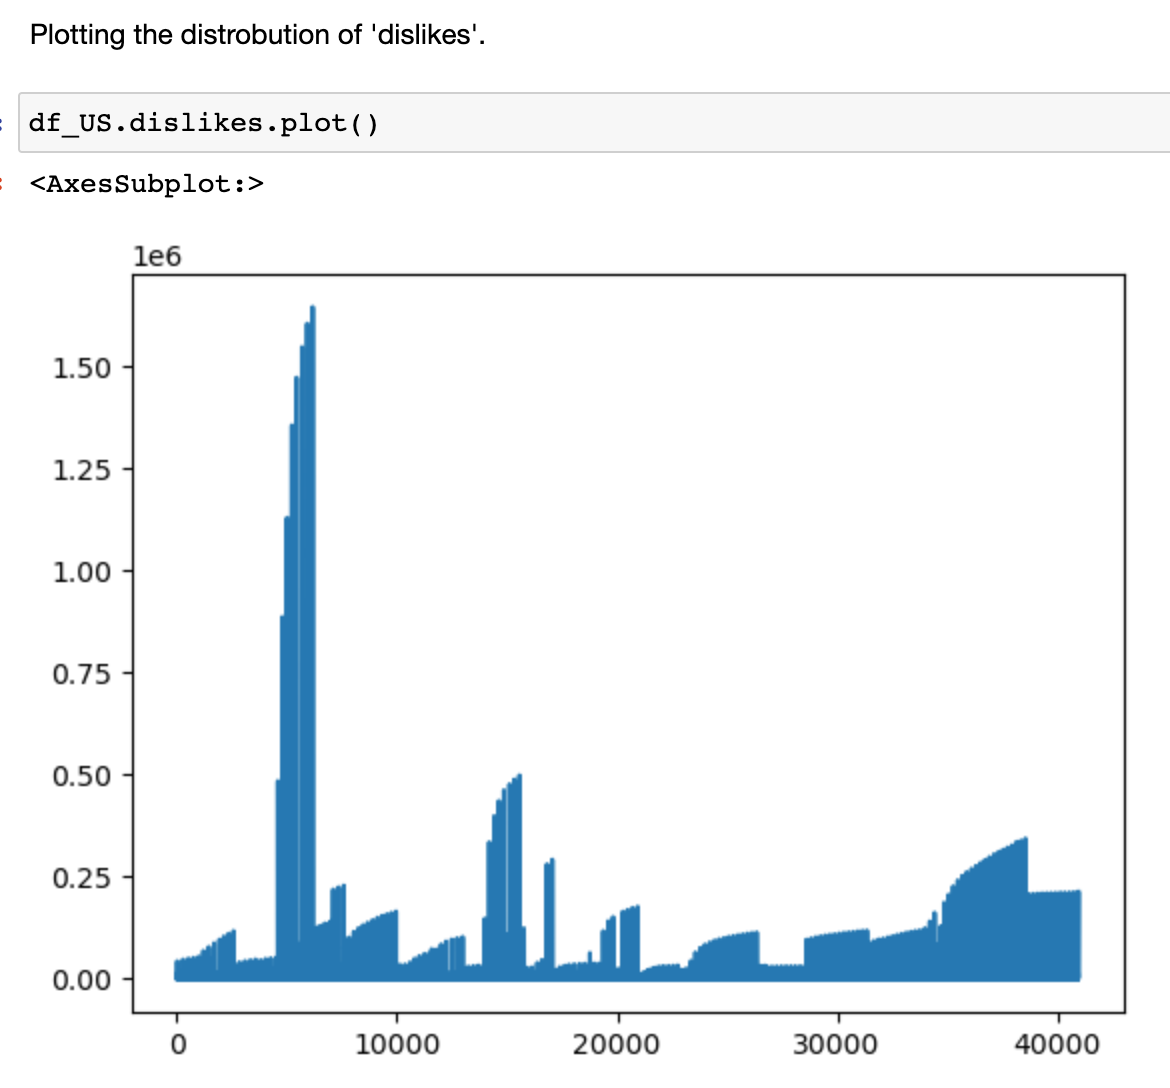
When all metrics where plotted against Upload_Hour the distribution takes a sharp-direction change.

Creating the KPI for exploration.
Engagment Per View (EPV) = 'views' / ('likes' + 'dislikes' + 'comment_count')


Now Cleaning and Exploring the remaining Countries Datasets
#-- Dropping all the rows with missing values --#
df_GB.dropna()
df_DE.dropna()
df_IN.dropna()
df_FR.dropna()
#-- Creating Total Engagment Per View, Per Country --#
EPV_GB = df_GB.views /(df_GB.likes + df_GB.dislikes + df_GB.comment_count)
EPV_DE = df_DE.views /(df_DE.likes + df_DE.dislikes + df_DE.comment_count)
EPV_IN = df_IN.views /(df_IN.likes + df_IN.dislikes + df_IN.comment_count)
EPV_FR = df_FR.views /(df_FR.likes + df_FR.dislikes + df_FR.comment_count)
#-- EPV per Country against Upload_Hour --#
All Countries had the same Prime Time

Conducting a Shapiro - Wilk Tests for normality.
#-- Running Shapiro Wilk test to gage normality of EPV--#
x6 = EPV
shapiro_test = stats.shapiro(x6)
shapiro_test
shapiro_test.statistic
shapiro_test.pvalue

The Output was “1”; Indicating a perfectly normal, Gaussian distribution. However, the individual metrics themselves where not Normal or Bell shaped but when combined together, make a “Bell Shape”.
#-- Running Shapiro Wilk test to gage normality of 'views'--#
x1 = df_US.views
shapiro_test = stats.shapiro(x1)
shapiro_test
shapiro_test.statistic
shapiro_test.pvalue

YouTube video ranking algorithm is deliberately targeting the West Coast, USA and not rewarding any-other upload time with engagement.
Why? Because that is the highest concentration of Americans in the world’s richest country per GPD.#-- The Output was the same when the normality test was repeated on all metrics indicating that the metrics where non-normal (non-parametric) in nature--#

According to circadian rhythms, the “biological clock” in all humans, 9 pm is when people are most engaged (nigms.nih.gov) The first reason is Circadian rhythms - essentially, the biological alarm-clock that operates in all humans.
There is no shortage of Big Data mining operations proving that 9PM is when people will engage for all content types.
From applying to jobs on LinkedIN, watching sports highlights, The Latest Netflix release, Dating sites, and of course adult websites.


Github link: Code for this Project.
More Related Articles
How to Market an Outdoor Movie with: Best Data-Driven Movie Playlist 2023
Podcast Interview with ChatGTP
Forecasting with Time Series Data
Natural Language Processing on IMDB movie comments
Principal Component Analysis with Telecom Data
Market Basket Analysis for Prescription Data
Hacking the System: Optimizing Humans to Increase Page Ranking
Drug Overdose Deaths Data Mining Exploration
Hospital Readmission Tool Dashboard
Data Analytics and Police Funding