

What are the Odds of Winning a Government Contract in 2024?

Abstract
Bottom Line Up Front: With 70% confidence an IoT company focusing on the 'End User', is more likely to get awarded a 5-year contract, if the company is part of a cooperative-purchase.
This data analysis delves into IoT contracts awarded to private companies by the State of Washington. It spans the years from 1975 and current contracts out to 2050. Key questions include identifying agencies issuing the largest contracts, the duration of contracts, and factors influencing contract awards. The dataset comprises 4,684 rows and 69 columns, with additional variables engineered for exploration.
Various machine learning models, including Principal Component Analysis (PCA), K-Means Clustering, Random Forest Regressor, XGBoost, and Market Basket Analysis (MBA), were employed. Market Basket Analysis yielded significant association rules, notably Rule 10, indicating that private companies focusing on the attribute: 'End User' are more likely to be awarded a 5-year contract if part of a cooperative-purchase.
Conclusions from PCA, K-Means Clustering, Random Forest Regressor, and XGBoost models suggest varying degrees of significance in predicting IoT contract behavior. Market Basket Analysis rejects the null hypothesis, indicating a significant association between contract attributes purchased by the State of Washington.
The distribution of contracts is non-random, with most starting in 2020 and July being a common start month. Correlation analysis reveals associations between 'End_User' and 'Network' with 'total_time'. Cooperative purchases show higher ratios of 'Total Contract Amount' and longer contract durations.
While this analysis provides insights into Washington State's IoT contracts, future research could expand to include data from other states for a comprehensive understanding.

Research Question(s):
Which Washington State agencies issue the largest contracts by 'Total Contract Amount'?
Which state agencies have the longest contracts?
Which state agencies issue the most 10-year contracts?
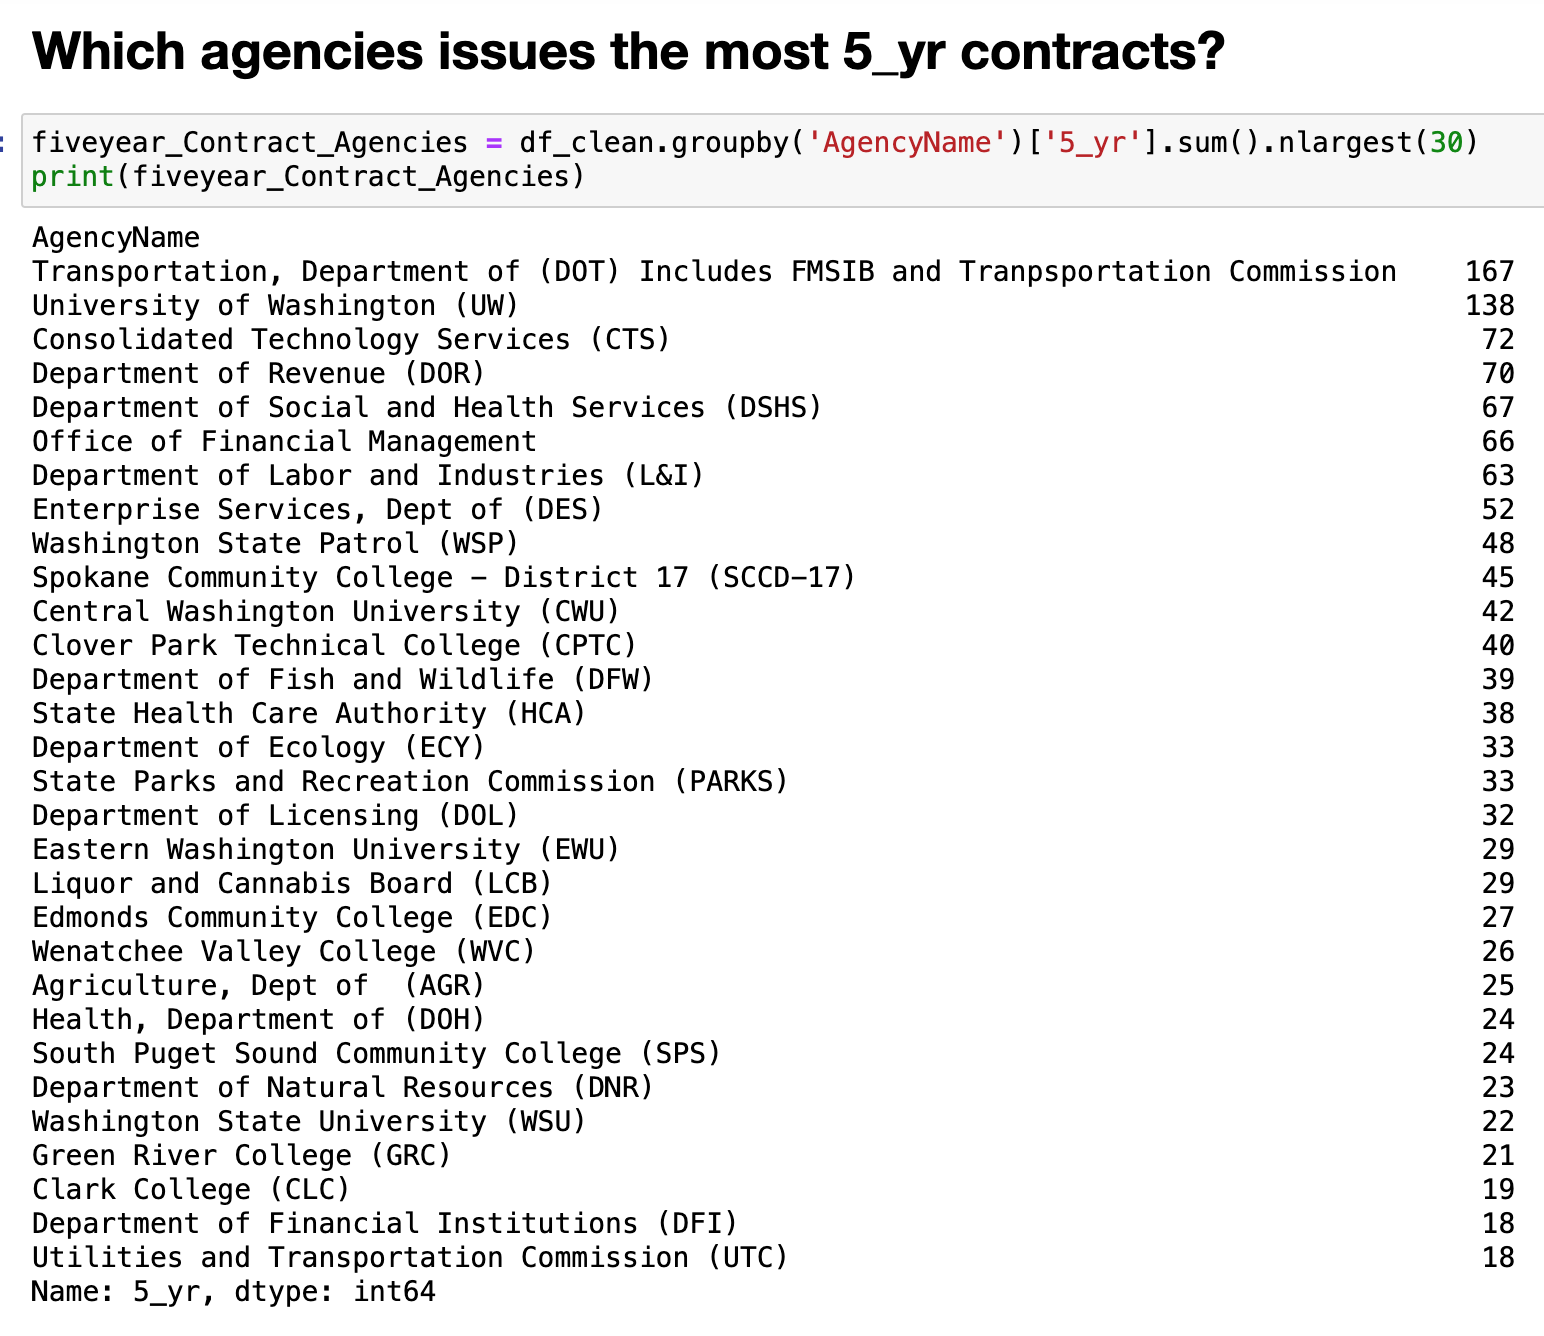
Which state agencies issue the most 5-year contracts?
Who are the top hired tech contractors?
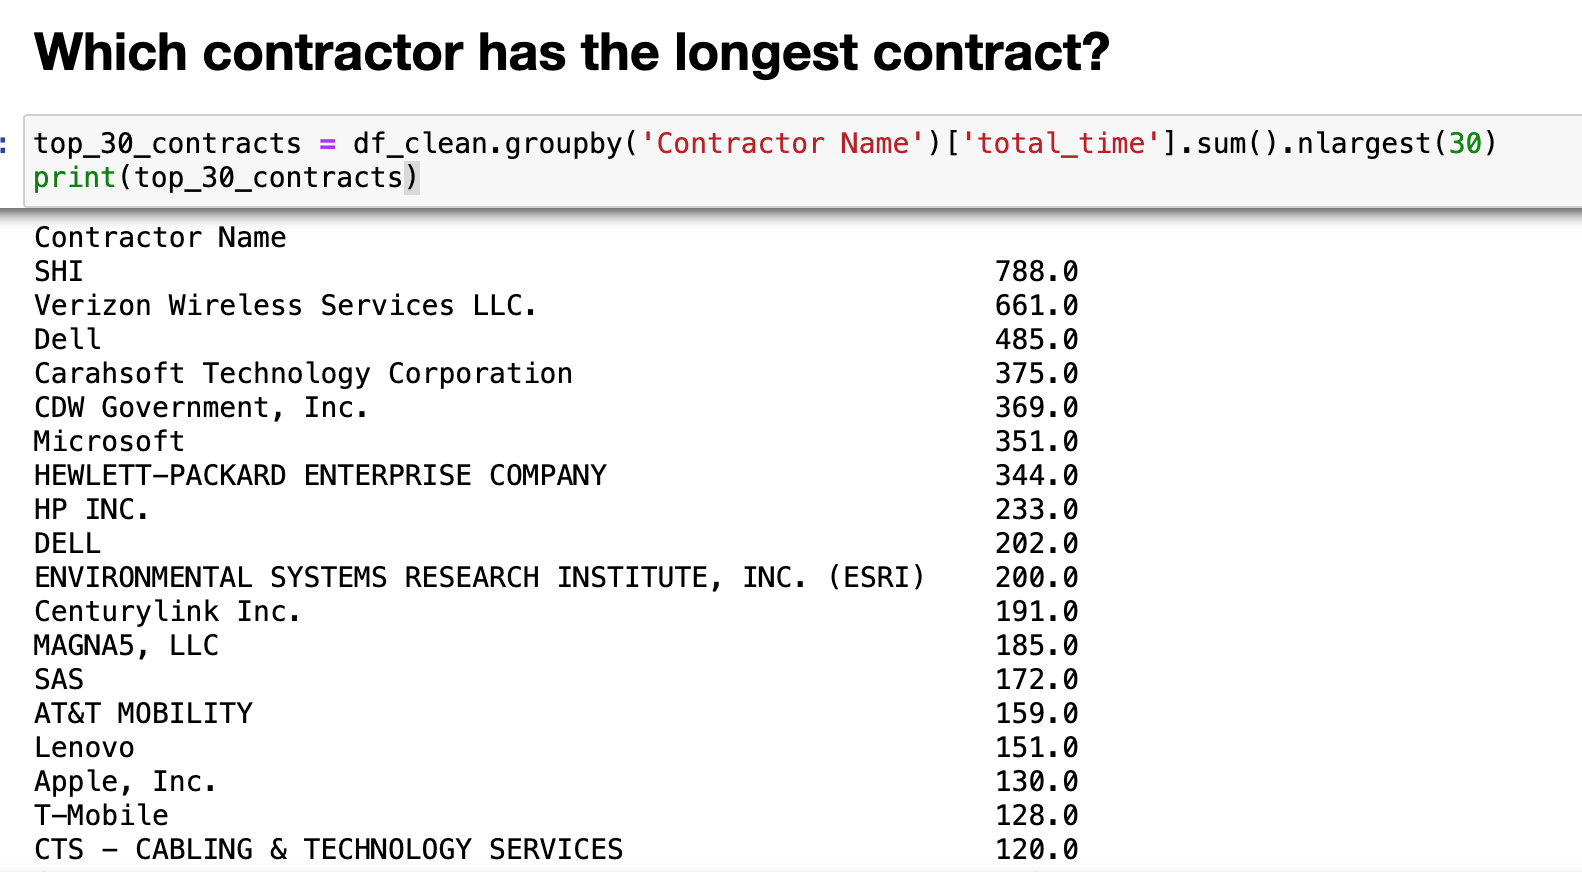
Which contractors have the longest contracts?
Which contractors have the most 10-year contracts?
Which contractors have the most 5-year contracts?
Can a predictive model be created to forecast 'Total Contract Amount'.
Can a Market Basket Analysis be used to predict Washington State agencies IoT-contract-purchasing-behavior?
Context:

This study is a contribution to the field of Data Science and industry intelligence. Creating a machine learning model to classify or predict Washington State IoT contracts awarded to private companies. With this information a software company can maximize the investment when applying for Washington State IoT contracts. According to the dataset, The Washington State Organizations/Institutions evaluate IoT contracts based off the following service characteristics:
Cooperative Purchase\n(Yes/No), Application, Compute, Data Center, End User, Delivery, Network, IT Management, Output, Platform, Security, Storage, Other/Non-IT.An article titled, Market Basket Analysis Evaluation and Scoring for Contract Award, showcases a study using Market Basket Analysis (MBA) testing to explore identical variables for contact purchasing probability (CDE, 2020). They found that MBA helps to understand purchasing patterns in overall contract bid selection and strength. Market Basket Analysis is a data mining technique that analyzes patterns of co-occurrence and determines the strength of the link between products purchased together (aws, 2020). Understanding these variables can help describe the relationship between the Independent Variables IVs and Dependent Variables DVs.

Hypotheses:
PCA Null Hypothesis (H0): There is no significant reduction in dimensionality achieved by PCA. The variance explained by the first k principal components is not significantly different from the total variance in the original dataset.
Alternative Hypothesis (H1): There is a significant reduction in dimensionality achieved by PCA. The variance explained by the first ‘k’ principal components is significantly different from the total variance in the original dataset.
K-means Clustering Null Hypothesis (H2): There is no significant difference between the groups identified by k-means clustering. The centroids of the clusters do not significantly differ from each other.
Alternative Hypothesis (H3): There is a significant difference between the groups identified by k-means clustering. At least one pair of cluster centroids is significantly different from each other.
Random Forrest Regressor Null Hypothesis (H4): There is no significant relationship between the predictor variables and the target variable in the context of a Random Forest model. The average prediction made by the Random Forest model is no different from the average of the actual target variable.
Alternative Hypothesis (H5): There is a significant relationship between the predictor variables and the target variable in the context of a Random Forest model. The average prediction made by the Random Forest model is significantly different from the average of the actual target variable.
XGboost Null Hypothesis (H6): There is no significant relationship between the predictor variables and the target variable in the context of a XGboost model. The average prediction made by the XGboost model is no different from the average of the actual target variable.
Alternative Hypothesis (H7): There is a significant relationship between the predictor variables and the target variable in the context of a XGboost model. The average prediction made by the XGboost model is significantly different from the average of the actual target variable.
MBA Null Hypothesis (H8): There is NO significant association between the IoT contract purchase of The State of Washington and product / service attributes.
Alternative Hypothesis (H9): There IS A significant association between the IoT contract purchase of The State of Washington and product / service attributes.

Data:
An open-source dataset of IT contracts awarded to companies by organizations under the State of Washington. Containing the necessary variables about agencies requesting service and the private agencies awarded the contract. A government dataset from Data.gov. Data.gov is the open-source government repository that hosts the datasets. The dataset contains almost 4,686 rows (before any rows where removed) and 69 columns. The dataset is limited to the metrics recorded. However, the dataset has multiple columns for possible exploration.
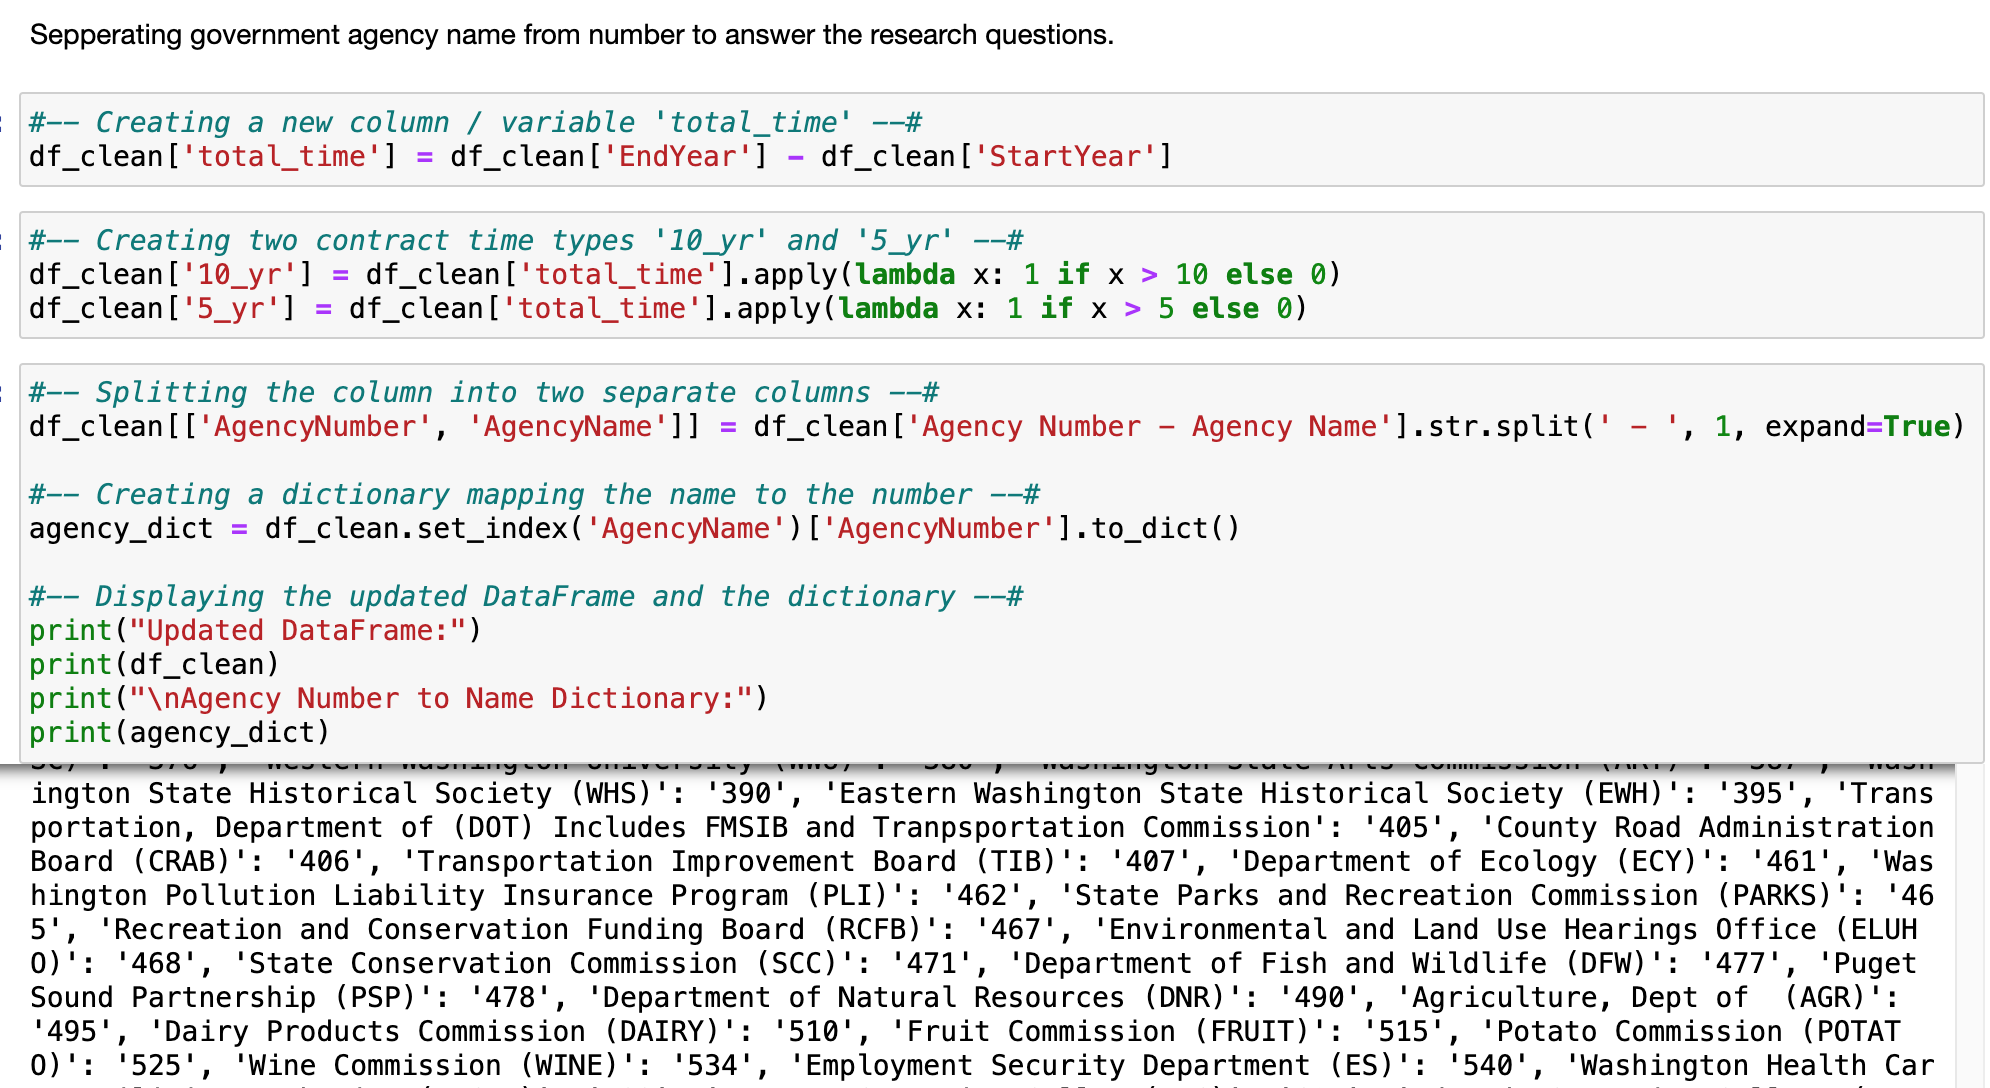
Delimitations for this analysis, of the 69 columns only 17 will factor into the exploratory analysis and 16 will factor into the regressive models; 15 features will factor into the final MBA model. Another limitation to the dataset is it is less than 7k rows and is not “big data”. Moreover, of the original 69, three additional variables were engineered for exploration and testing. They are "total_time", "5_yr" (representing 5-year contracts), and "10_yr" (representing 10-year contracts). A copy of the original dataset can be downloaded from the link below:
https://data.wa.gov/dataset/IT-Contracts-Report-2022/dzvi-rs2c/about_data
Available to the public via the government, meaning that the dataset may be limiting in accuracy and completeness.
Below is the list of variables that factor into this analysis:


Data Gathering:
Plan and direct data gathering to opensource repositories (Google). Looking for keywords such as “IT”, “IoT”, “contracts”, “+ .csv”. Next, selecting the 1st to 3rd ranked piece of content (reachable csv file) and inspecting each csv file for quality such as “length”, data cleanliness, massive gaps in data, and enough relevant variables to create an ‘X’ and ‘Y’ axis. The dataset is 0.018 % sparse and all missing or null columns will be dropped when cleaning the dataset.
Available to the public via data.gov means that it may be limiting in accuracy and completeness. In Market Basket Analysis, the variables that make up the association rules do not imply a causal relationship but a co-occurrence (TowardsDataScience, 2021).
Data Analytics Tools and Techniques
According to the vanguard of MBA, Amazon.com:
Market Basket Analysis (MBA) makes several assumptions about the variables involved. Here are some common assumptions:
Binary Data:
The data is binary, meaning each item is either present or absent in a transaction.
Independence:
The items in the basket are assumed to be independent of each other.
This implies that the purchase of one item does not influence the purchase of another.
Fixed Basket Size:
The number of items in a basket is assumed to be fixed.
Static Transactions:
MBA often assumes that transactions are static, meaning that the set of items in a transaction does not change over time.
No Quantity Information:
MBA typically doesn't consider the quantity of items bought, only whether an item is present or not.
It assumes that the occurrence of an item in a transaction is the relevant information.
Customer Homogeneity:
MBA assumes a degree of homogeneity among customers.
This means that the behavior of one customer is representative of the behavior of other customers.
No Time Sensitivity:
MBA often assumes that the order in which items are purchased doesn't matter.
In some cases, the temporal order might be important, and other methods like sequence analysis might be more suitable (aws, 2022).

A KDE plot was used to visualize the distribution. Market Basket Analysis is germane to studying this data because it can compare cooccurrences of purchasing data. Overall, this is an exploratory quantitative data analytic technique and a descriptive statistic. The tools used will be Jupyter Notebook operating in Python code, running statsmodel api as a reliable open-source statistical library. Due to the data size, a Pandas data frame will be called, same with Numpy and Seaborn will be used for visualizations. Principal Component Analysis will be used for exploration via dimensionality reduction and is necessary for K-means. K-means is used for visual inspection of the residuals in a 3D space; That will help assess the assumptions of ‘fixed basket size’ with MBA. Random Forrest Regressor and XGboost are powerful ensemble methods that can be powerful for predicting Independent Variables. The ensemble methods are helpful because they can process non-parametric data; Along with a presentation layer consisting of Univariate and by Bivariate graphs.
Justification of Tools/Techniques:
Python will be used for this analysis because of Numpy and Pandas packages that can manipulate large datasets (IBM, 2021). The tools and techniques are common industry practice and have consensus of trust. The technique is justified through the integer variables necessary to plot against a timeline. In so doing, may just reveal different modes of frequency distribution. Another reason why MBA test is ideal is because the data is based on purchasing behavior. Because of the size of the dataset, pandas and Numpy will be called. Python is being selected over SAS because the Python has better visualizations (Panday, 2022).
Project Outcomes: To find statistically significant differences, the proposed end state is to answer the research questions and provide a Market Basket Analysis statistical model that can create association rules between co-occurrences of purchasing software contract attributes (Statology, 2019). A visualization of the frequency distribution of the independent variables and a cleaned dataset of all the correctly labeled columns and rows, for replication. A better understanding of previously stated groups with exploratory graphs, giving support as to the model expectations. Lastly, a copy of the Jupyter NoteBook with the Python code will be available, along with a video presentation. According to the same study MBA was instrumental in support for alternative hypothesis, against other categorical variables (USDA, 2020).

Here is a link to the code on Github.


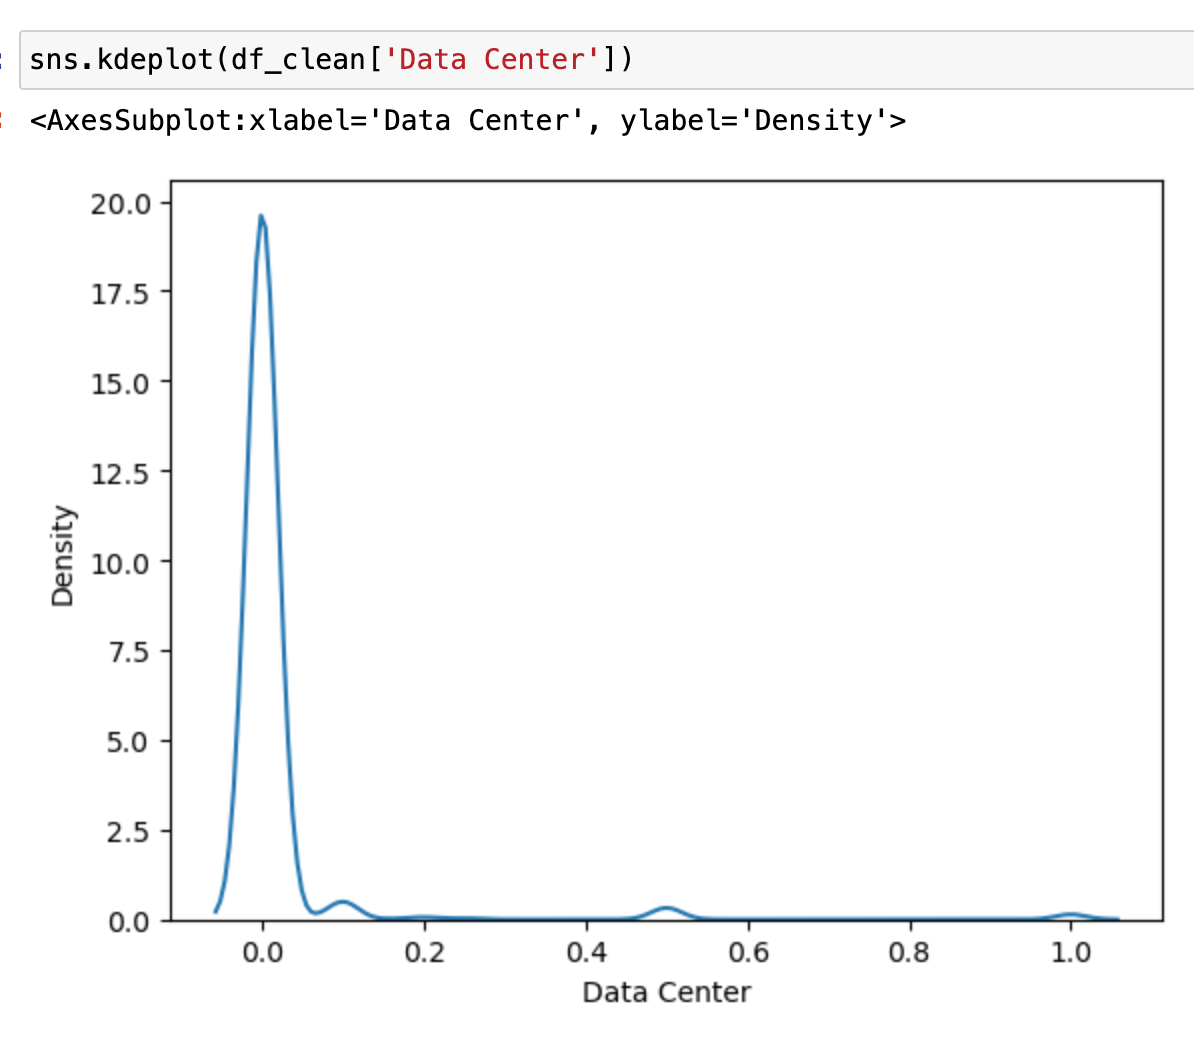


The above contract attribute distributions are basically binary. The majority of attributes have either two and sometimes three distinct modes.
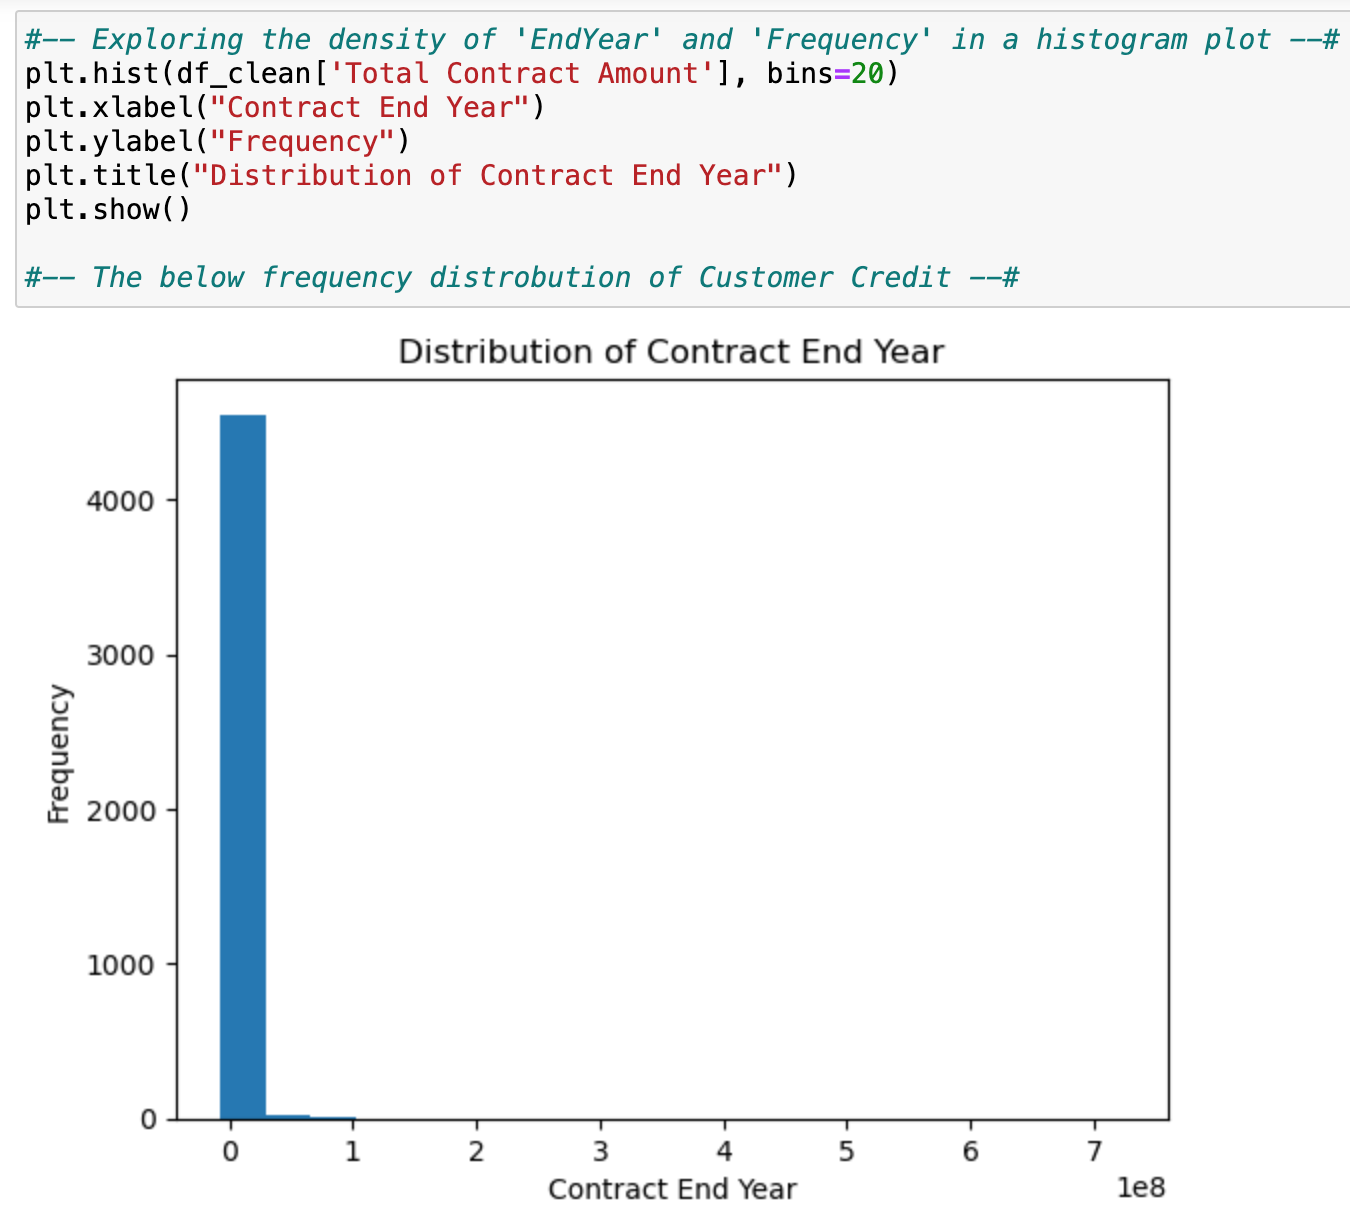
Now displaying the frequency distribution of Total Contract Amount.

Most contracts end in June.

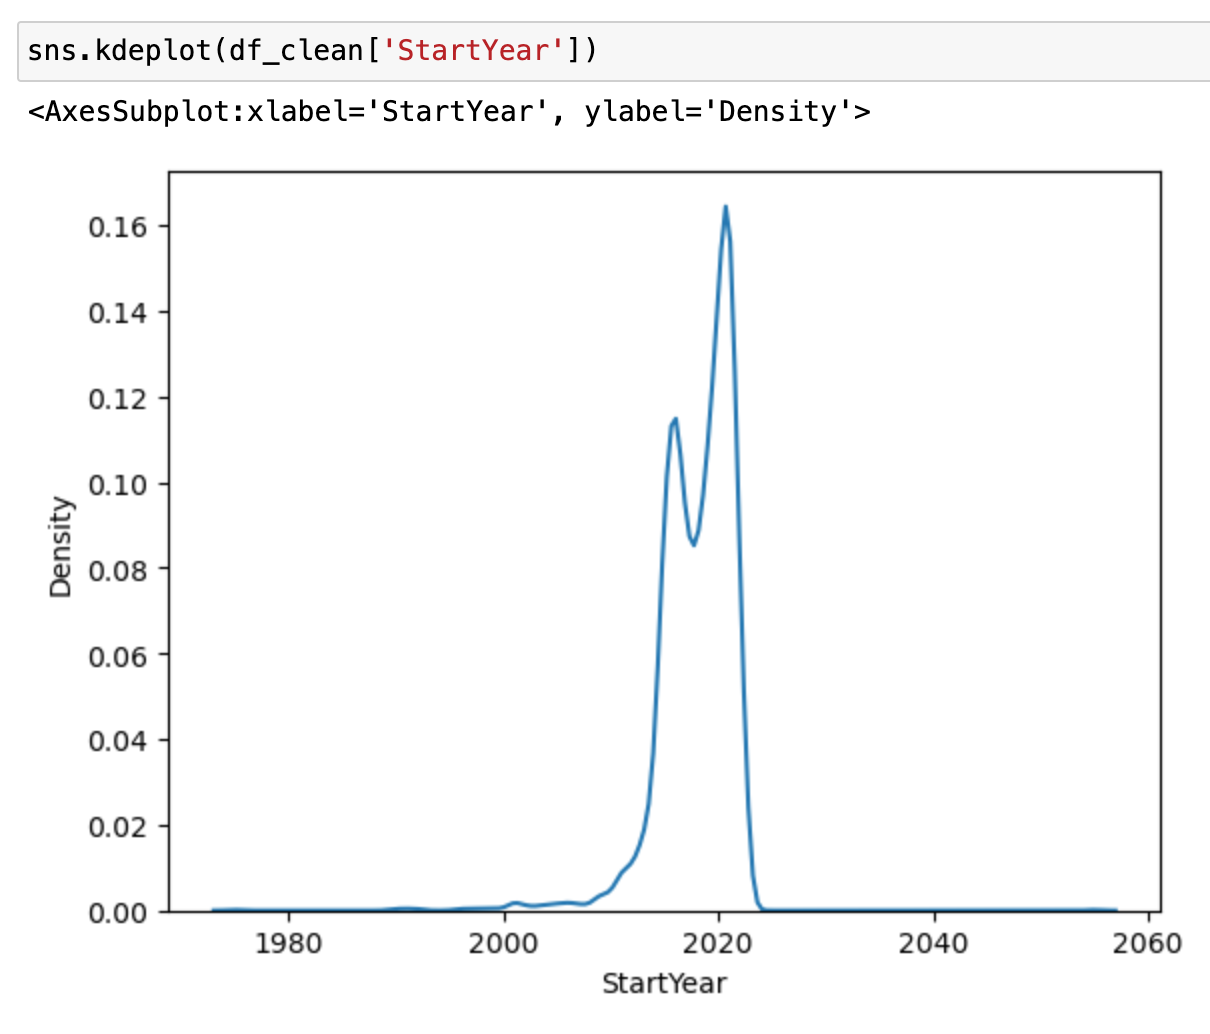
Most contracts end in June 2025 and started in July on 2020.


Now exploring the binary distribution of Cooperative Purchase. Notice that the Cooperative Purchases consist of less than half of the total contracts.

The below graph shows the frequency of Cooperative Purchase is significantly greater for 5-year contracts.

The below graph indicates that Cooperative Purchases have a higher average of ‘Total Contract Amount’ compared to Non-CoOp.

While Non-CoOps have significantly more 10-year contracts.

The inverse is true for 5-year contracts.

The below graph visualizes that contracts out to 2050 have the highest ‘Total Contract Amount’.

1996 was year Washington State awarded the most lucrative contracts. The reduction of state spending on IoT contracts correlates with Moores Law: Computation gets exponentially faster and cheeper (IBM, 2019).


The following outputs answer the research questions:
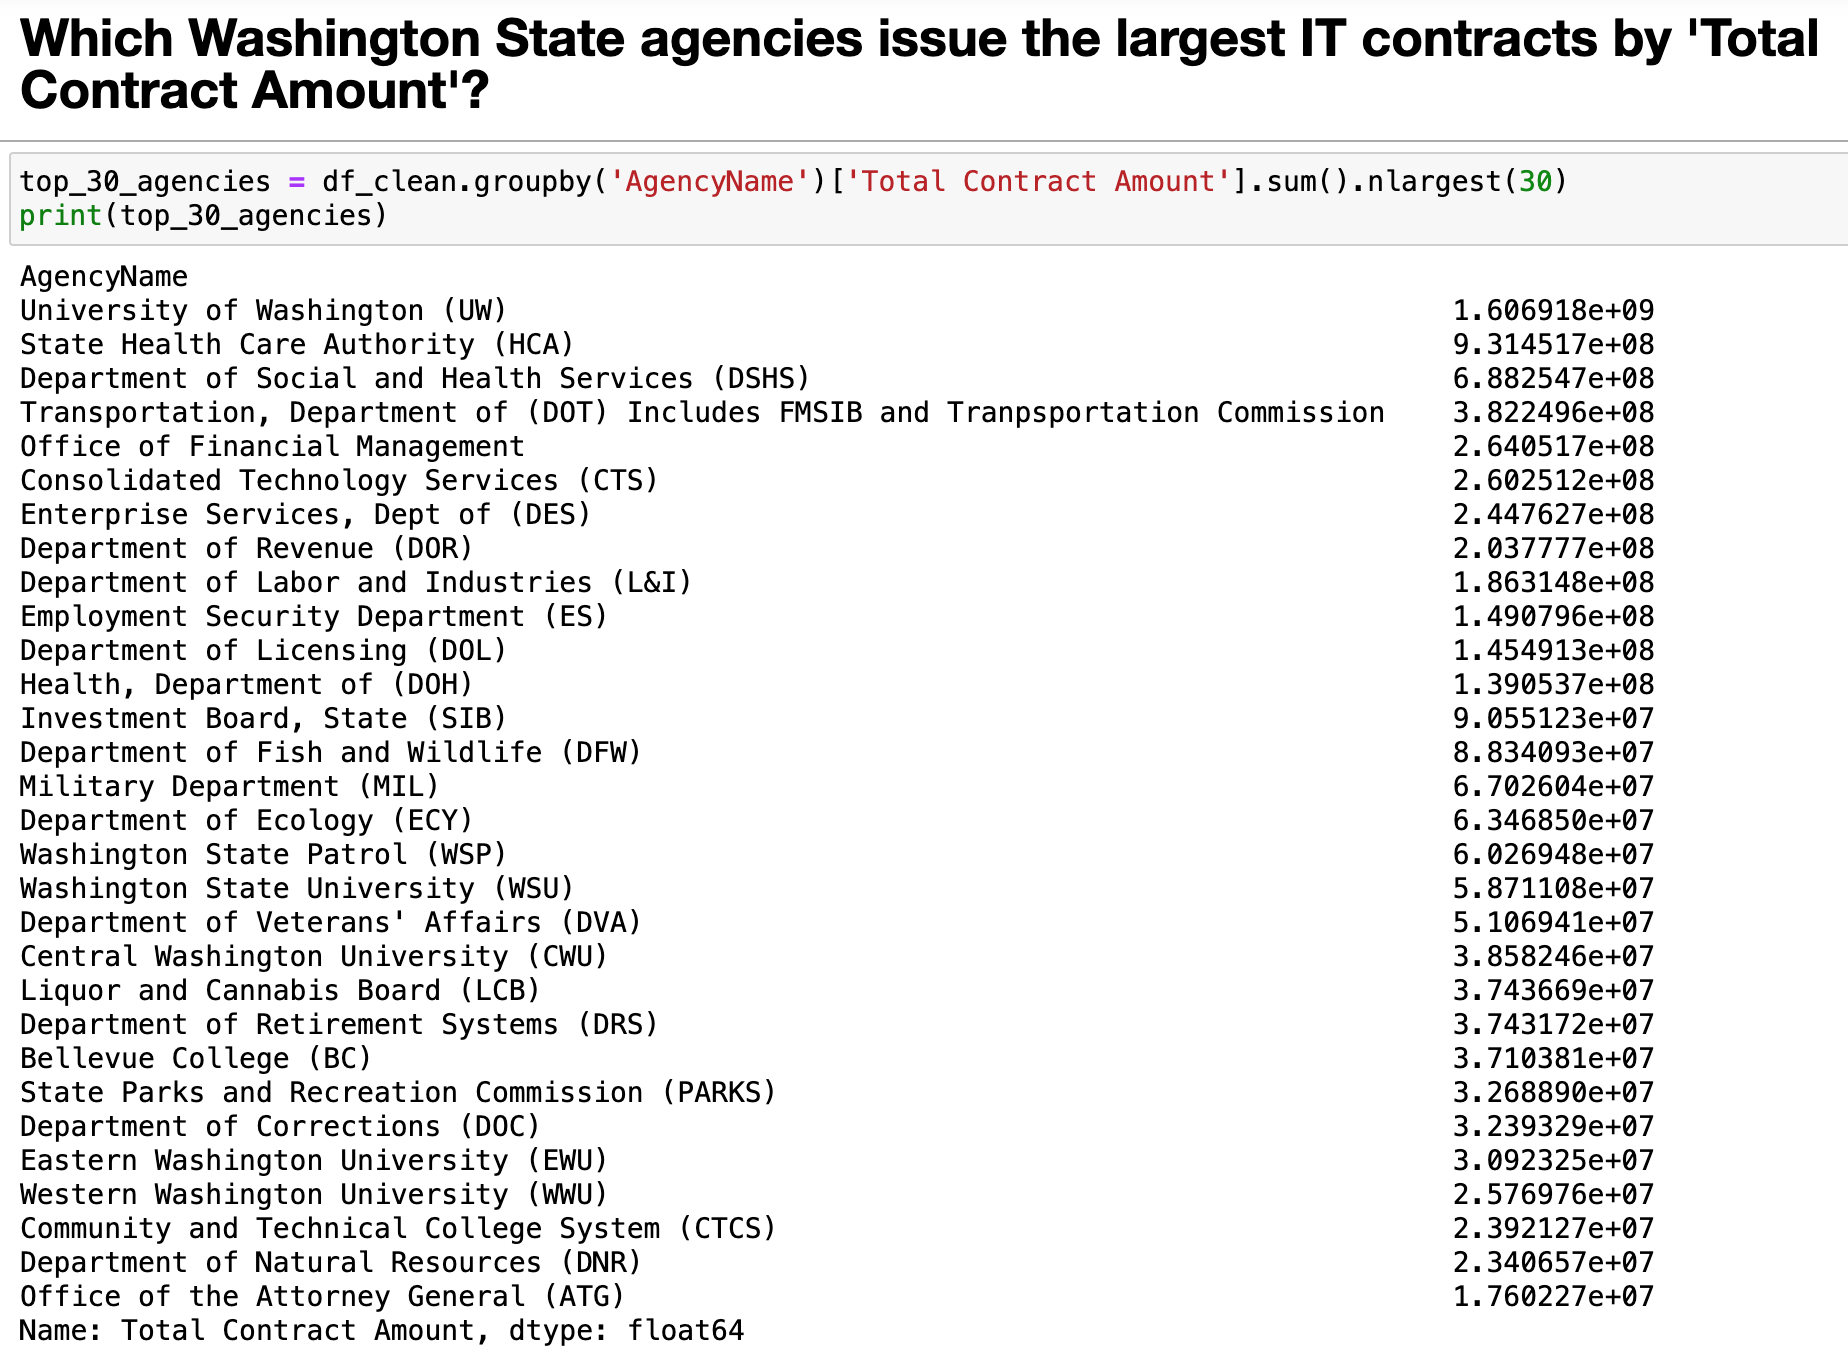


According to the outputs, Community Colleges and State Universities. It also appears the University of Washington is common issuer of contracts; At the same time, a contract winner for 10-year contracts.


The above commented out data frames were the only combinations of variables that produced an accurate outcome in the ensemble predictions. When the feature “total_time” was engineered, it was able to be inferred easily due to the high multicollinearity with ‘10_yr’ and ‘5_yr’ variables. That can been seen in the below Person Correlation matrix; it is basically a true 40 /60 split (aside from the whole chart being off by one percent). Additionally, in the datasets ‘.csv’ file, visual indicators are evident in the fiscal year columns representing payments (past or future) to the companies. Most contracts are in groupings of either five or ten+ years. Moreover, these groupings will become visualized with K-means outputs.
Furthermore, predicting of ‘total_time’ is fallacious because it is akin to predicting: “How long a home-mortgage would be based off of a user-input of either ‘15 year’ and / or ‘30 year’”. The output would most probably be a 40/60 split of 15-year or 30-year-mortgages, 73% of the time. That is one example of understanding statistics / Data Science to combat the rise of charlatanism in Artificial Intelligence (Kozyrkov, 2023).


Now two clusters..

Now three clusters..

Now 4 clusters..


Now attempting to make prediction models for “Total Contract Amount”.
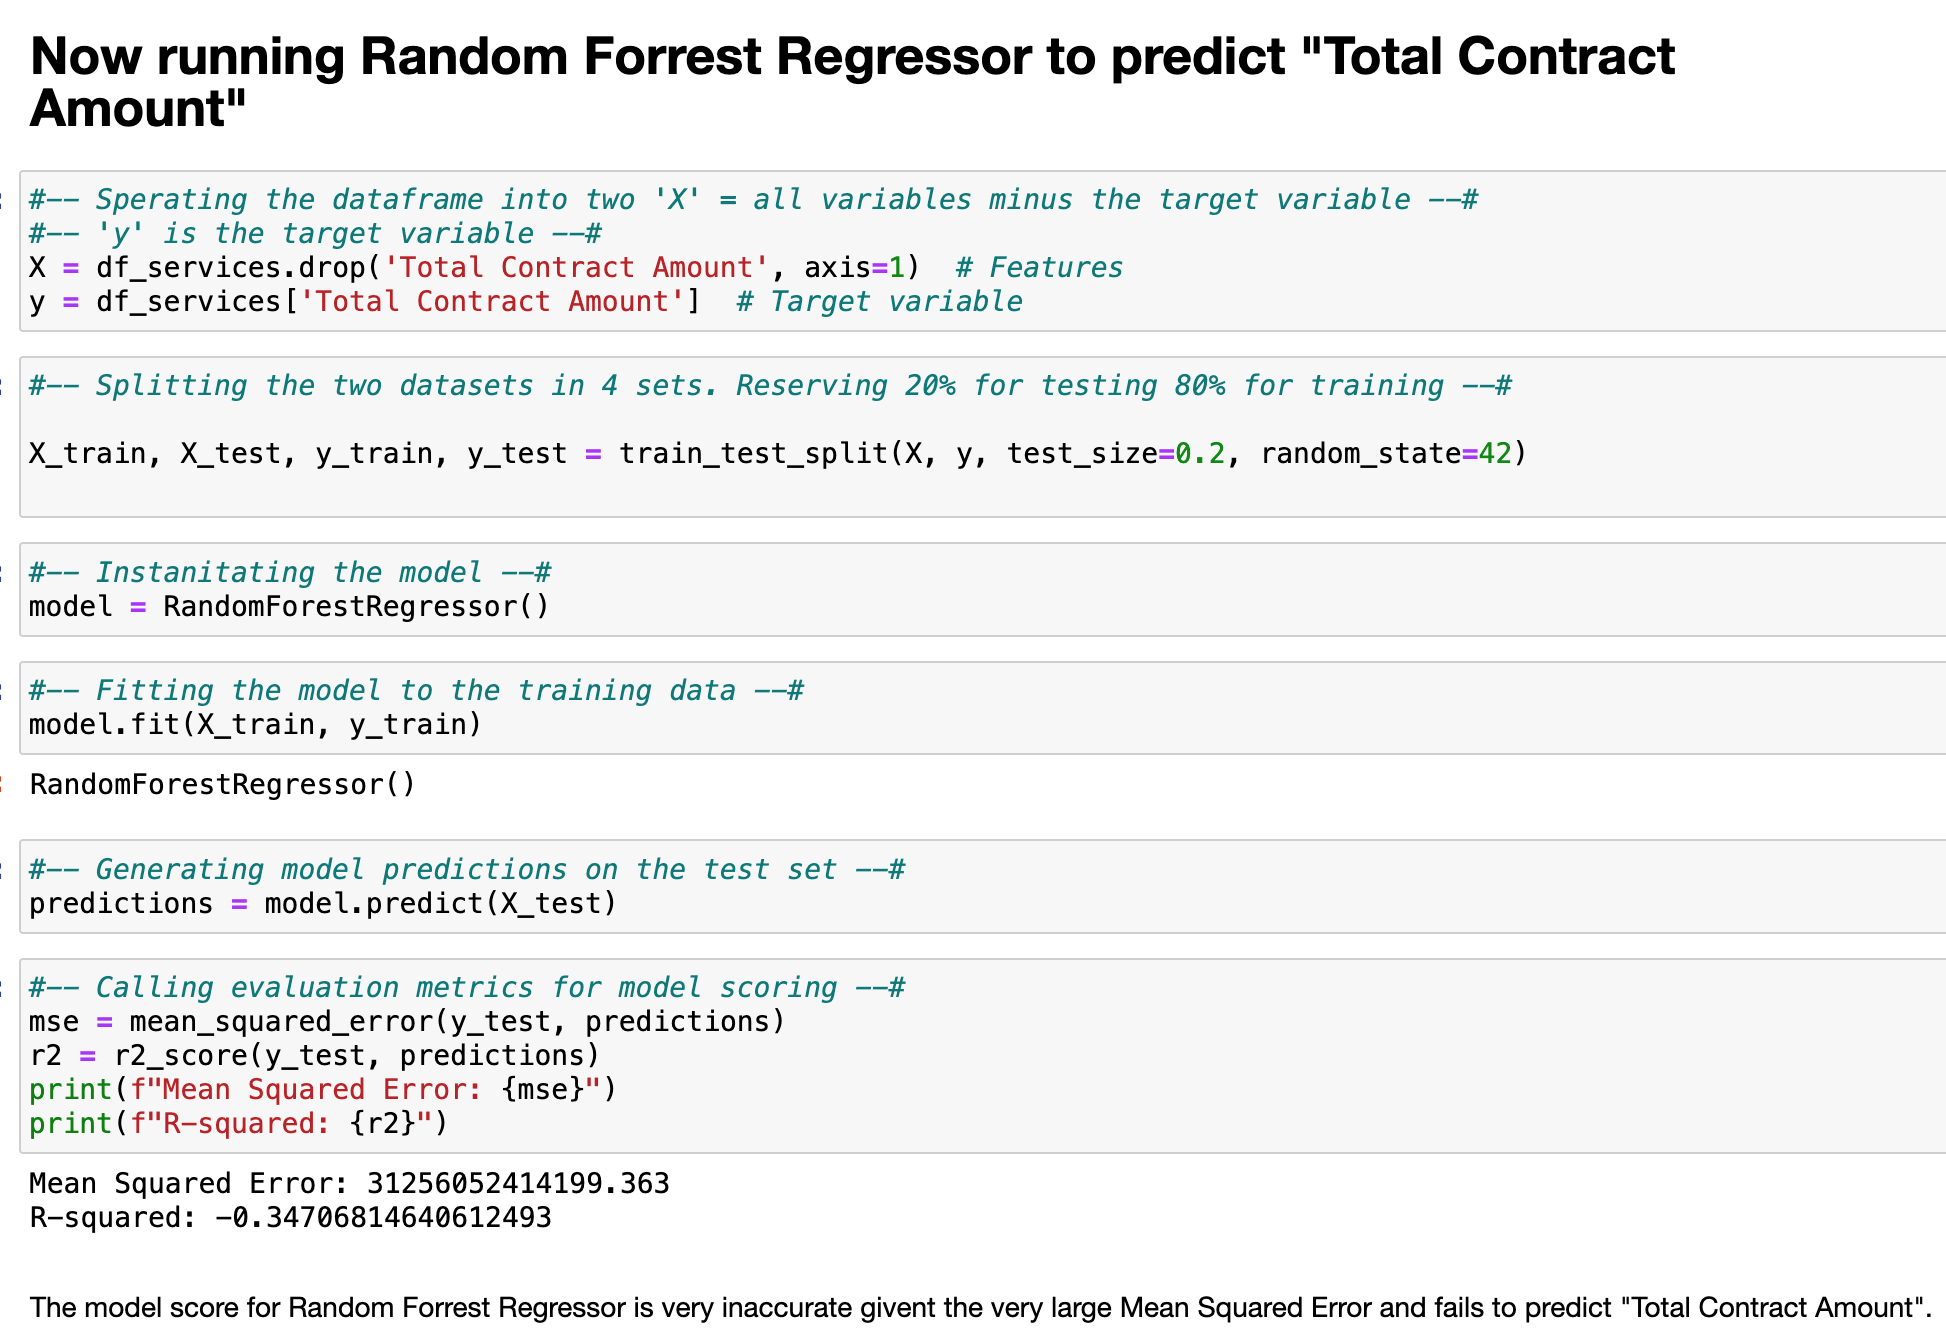


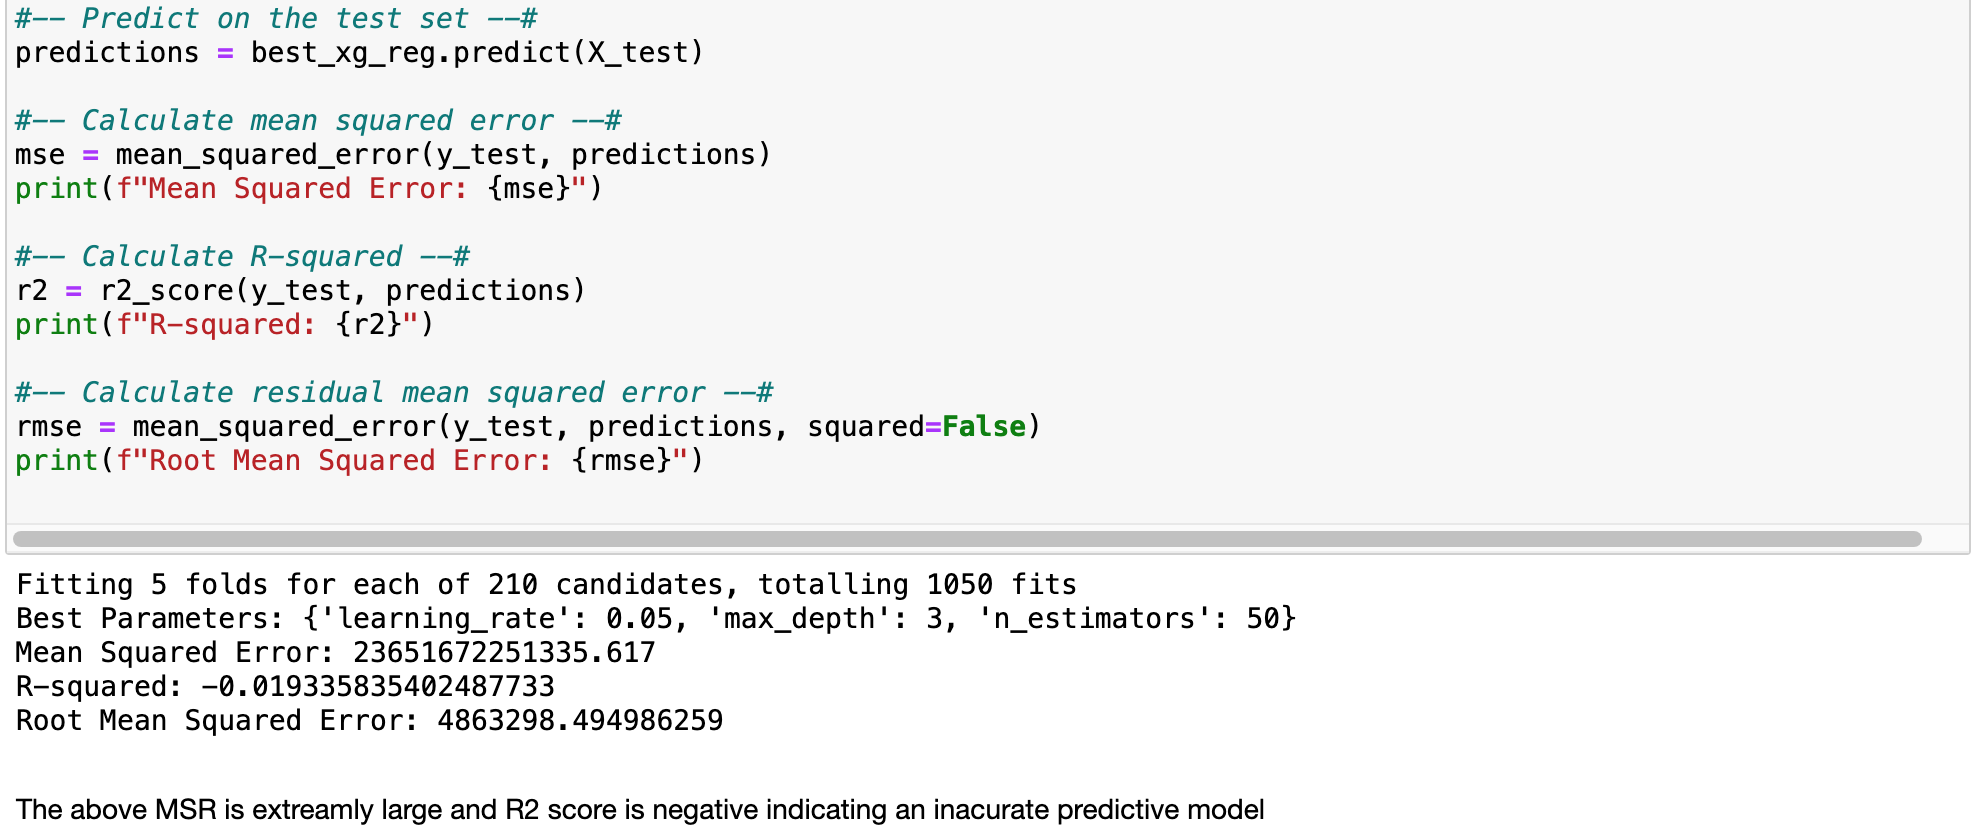

The predictive models did not score well. However, Market Basket Analysis performs well and the prior visualizations suggest that the dataset conforms to the model assumptions.


Conclusions:
We accept the PCA Null Hypothesis (H0): There is no significant reduction in dimensionality achieved by PCA. The variance explained by the first ‘k’ principal components is not significantly different from the total variance in the original dataset.
We accept the K-means Clustering Null Hypothesis (H2): There is no significant difference between the groups identified by k-means clustering. The centroids of the clusters do not significantly differ from each other.
We accept the Random Forrest Regressor Null Hypothesis (H4): There is no significant relationship between the predictor variables and the target variable in the context of a Random Forest model. The average prediction made by the Random Forest model is no different from the average of the actual target variable.
We accept the XGboost Null Hypothesis (H6): There is no significant relationship between the predictor variables and the target variable in the context of a XGboost model. The average prediction made by the XGboost model is no different from the average of the actual target variable.
We Reject the Market Basket Analysis Null Hypothesis (H8): There is NO significant association between the IoT contract purchase of The State of Washington and product / service attributes. In favor of the Alternative Hypothesis (H9):
There IS A significant association between the IoT contract purchase of The State of Washington and product / service attributes.

In final analysis,
This investigation into IoT contracts awarded by the State of Washington sheds light on critical aspects of the procurement landscape. The exploration of agencies issuing substantial contracts, contract durations, and influential factors provides a nuanced understanding of the state's IT procurement dynamics.
Machine learning models, including Principal Component Analysis, K-Means Clustering, Random Forest Regressor, XGBoost, and Market Basket Analysis, were pivotal in extracting meaningful patterns from the dataset. Notably, Market Basket Analysis revealed intricate association rules, emphasizing the impact of cooperative purchases on contract duration, particularly in the context of 'End User' focus.
The findings from PCA, K-Means Clustering, and predictive models like Random Forest Regressor and XGBoost underscore the complexity of predicting IT contract behavior. While some models show promising results, the dynamic nature of IT procurement suggests a need for ongoing refinement and adaptation.
The rejection of the null hypothesis in Market Basket Analysis indicates a substantive relationship between contract attributes and the State of Washington's purchasing behavior. The non-random distribution of contracts, correlation between specific attributes, and the influence of cooperative purchases signify the multifaceted nature of procurement decisions.
As this analysis provides a comprehensive baseline for Washington State, future endeavors could expand to encompass data from multiple states. Such an approach would offer a broader perspective, facilitating more nuanced comparisons and generalizable insights into IT procurement across different jurisdictions.
In conclusion, this research not only contributes to the understanding of Washington State's IT procurement landscape but also underscores the intricate interplay of variables that influence such decisions. It sets the stage for further exploration and refinement, encouraging a continual evolution in the realm of data-driven insights for public sector IT contracts.
Bottom Line: With 70% confidence an IoT company focusing on the 'End User', is more likely to get awarded a 5-year contract, if the company is part of a cooperative-purchase.
What is a Cooperative Purchase?

Work Cited
CACFP. Market Basket. (n.d.). https://www.cdss.ca.gov/cacfp/resources/procurement/usda-policy-guidance/market-basket
Chaudhary, S. (2022, February 11). Understanding market basket analysis in data mining. Understanding Market Basket Analysis in Data Mining. https://www.turing.com/kb/market-basket-analysis
Common procurement terms | CDE - Colorado Department of Education. (n.d.-a). https://www.cde.state.co.us/nutrition/commonprocurementterms
Kozyrkov, C. (2023, April 30). How to spot a data charlatan. Medium. https://towardsdatascience.com/how-to-spot-a-data-charlatan-85785c991433
Market basket analysis - amazon web services. (n.d.-b). https://rstudio-pubs-static.s3.amazonaws.com/707718_af6a0861e5ef4e3d928d1f4fdee9dd3f.html
Market basket analysis when procuring program goods and modifying contracted-for product lists. Food and Nutrition Service U.S. Department of Agriculture. (n.d.). https://www.fns.usda.gov/usda-fis/market-basket-analysis-when-procuring-program-goods-and-modifying-contracted-product-lists
Team, I. C. (2021, March 23). Python vs. R: What’s the difference? IBM Blog. https://www.ibm.com/blog/python-vs-r/
Read about more great data mining finds:How Many People Have Been Killed in Tesla fires?
What is the Best Time to Upload to Youtube?
How Many Solar Panels do You Need to Power a House?
How to Forecast Drug Overdose Deaths?